Pivot tables can be a helpful tool if you're planning to explore, analyze and compare data.
Increases in volume and complexity of your Excel data sets often make it difficult to analyze and utilize information. Since manually sorting through loads of data-packed rows can be tedious and time consuming, Excel’s pivot table feature can come in handy.
Pivot tables allow you to quickly and easily summarize, analyze, explore, and present large data sets in Excel. With just a few clicks, you can drag-and-drop fields to dynamically filter, group, and summarize your pivot tables' data. This makes it easier to spot trends, identify patterns, and glean insights from large data sets.
In this guide, we will walk you through the process of creating a pivot table in Excel without spending hours juggling with complex data.
What is a pivot table in Excel?
A pivot table is one of Excel's most useful data analysis features. These tables provide an interactive yet easy way to reorganize, analyze, and summarize data. In a few clicks, pivot tables can help you discover key insights, trends, and patterns hidden within your data set that would be difficult to uncover otherwise.[1]
What are pivot tables used for?
Pivot tables are a versatile tool for exploring and making sense of data. With pivot tables, you can:
Summarize and aggregate data: Pivot tables allow you to calculate totals, averages, counts, and perform other aggregate functions for your data.
Compare and analyze data: You can compare different data points, identify trends, and analyze relationships between variables.
Filter and sort data: Pivot tables provide flexible filtering and sorting options, allowing you to focus on specific subsets of data.
How to create a pivot table in Excel
Excel pivot tables are easier to make than you may think. Follow these simple instructions to transform your raw data into a simpler version and use it to draw meaningful insights.
Enter data into a range of rows and columns
Begin by entering all your data in a worksheet within a spreadsheet. Make sure to organize it into rows and columns, and add a header to each column.
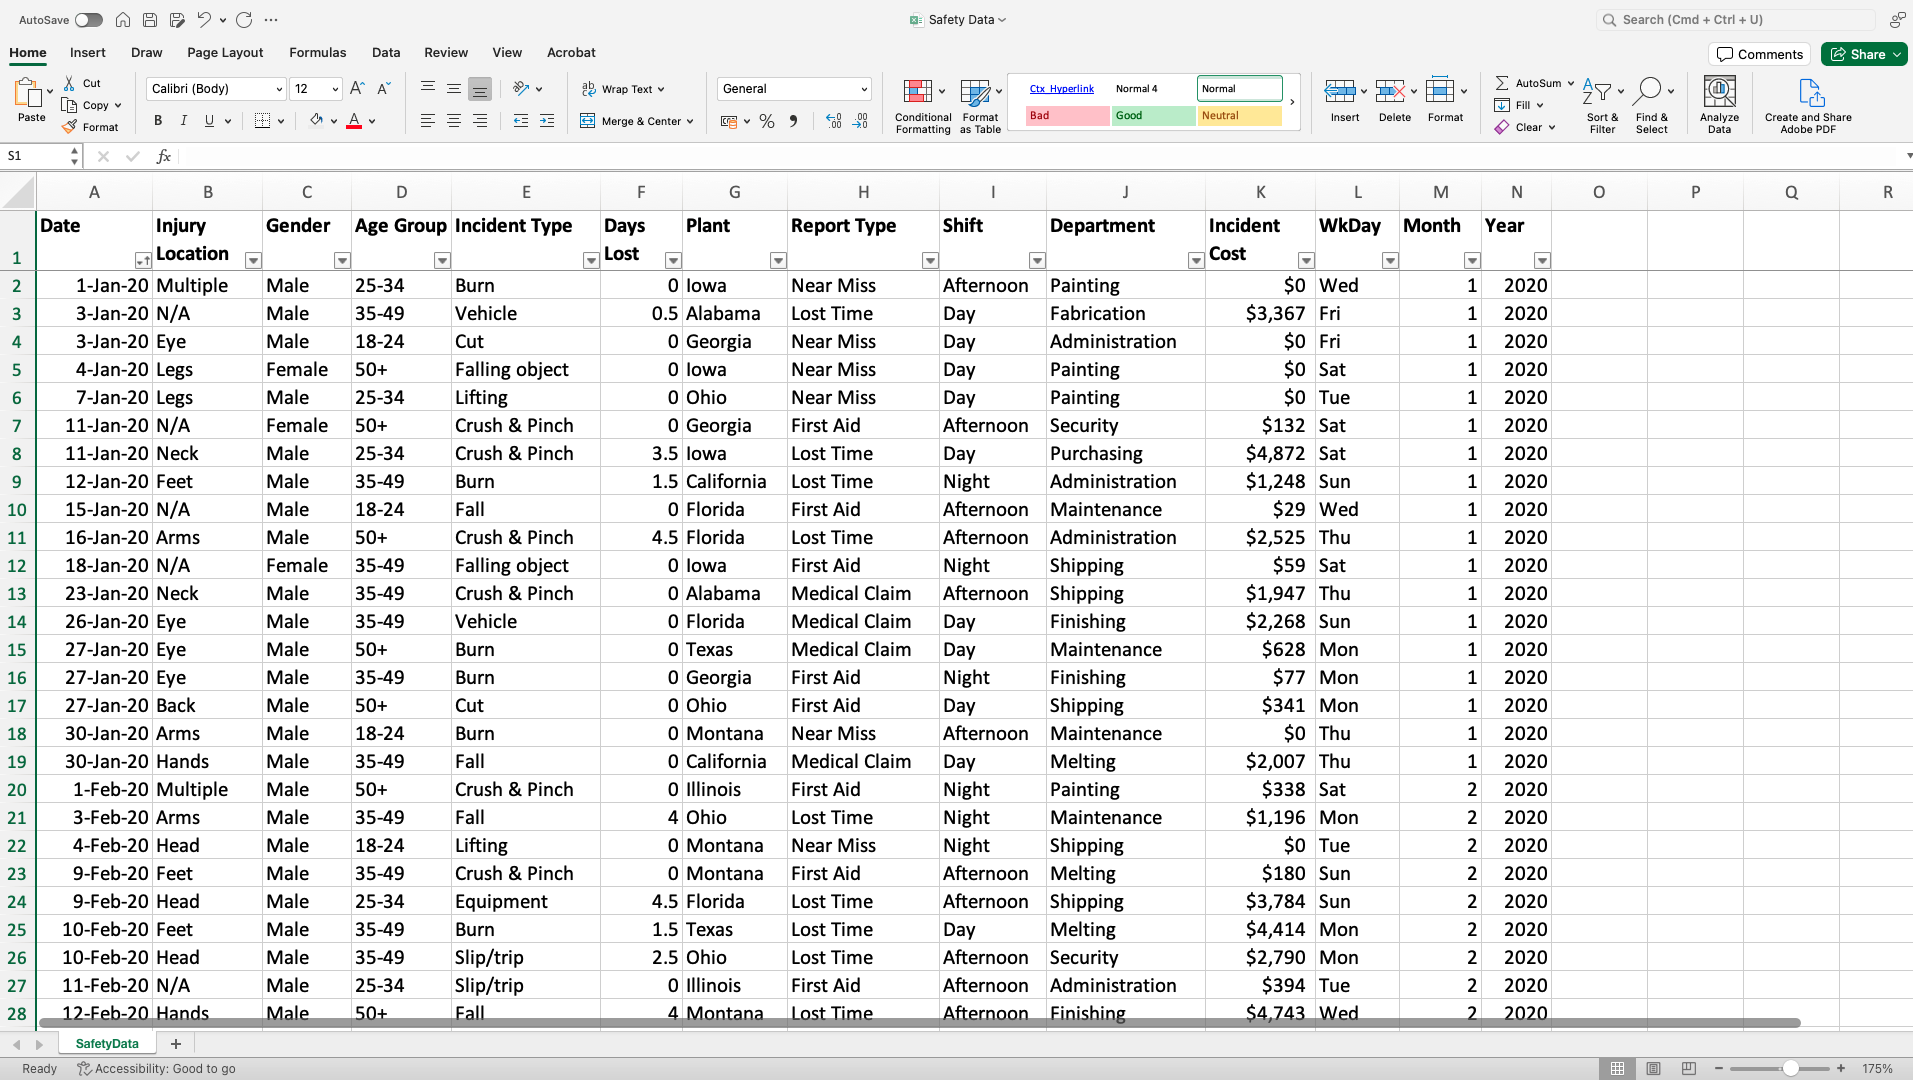
Enter your data into a worksheet
Highlight your cells to create your pivot table
With your data in place, it's time to highlight the cells that contain the data range you want to include in your pivot table. Selecting the relevant data will help you ensure that the pivot table captures the necessary information for analysis.
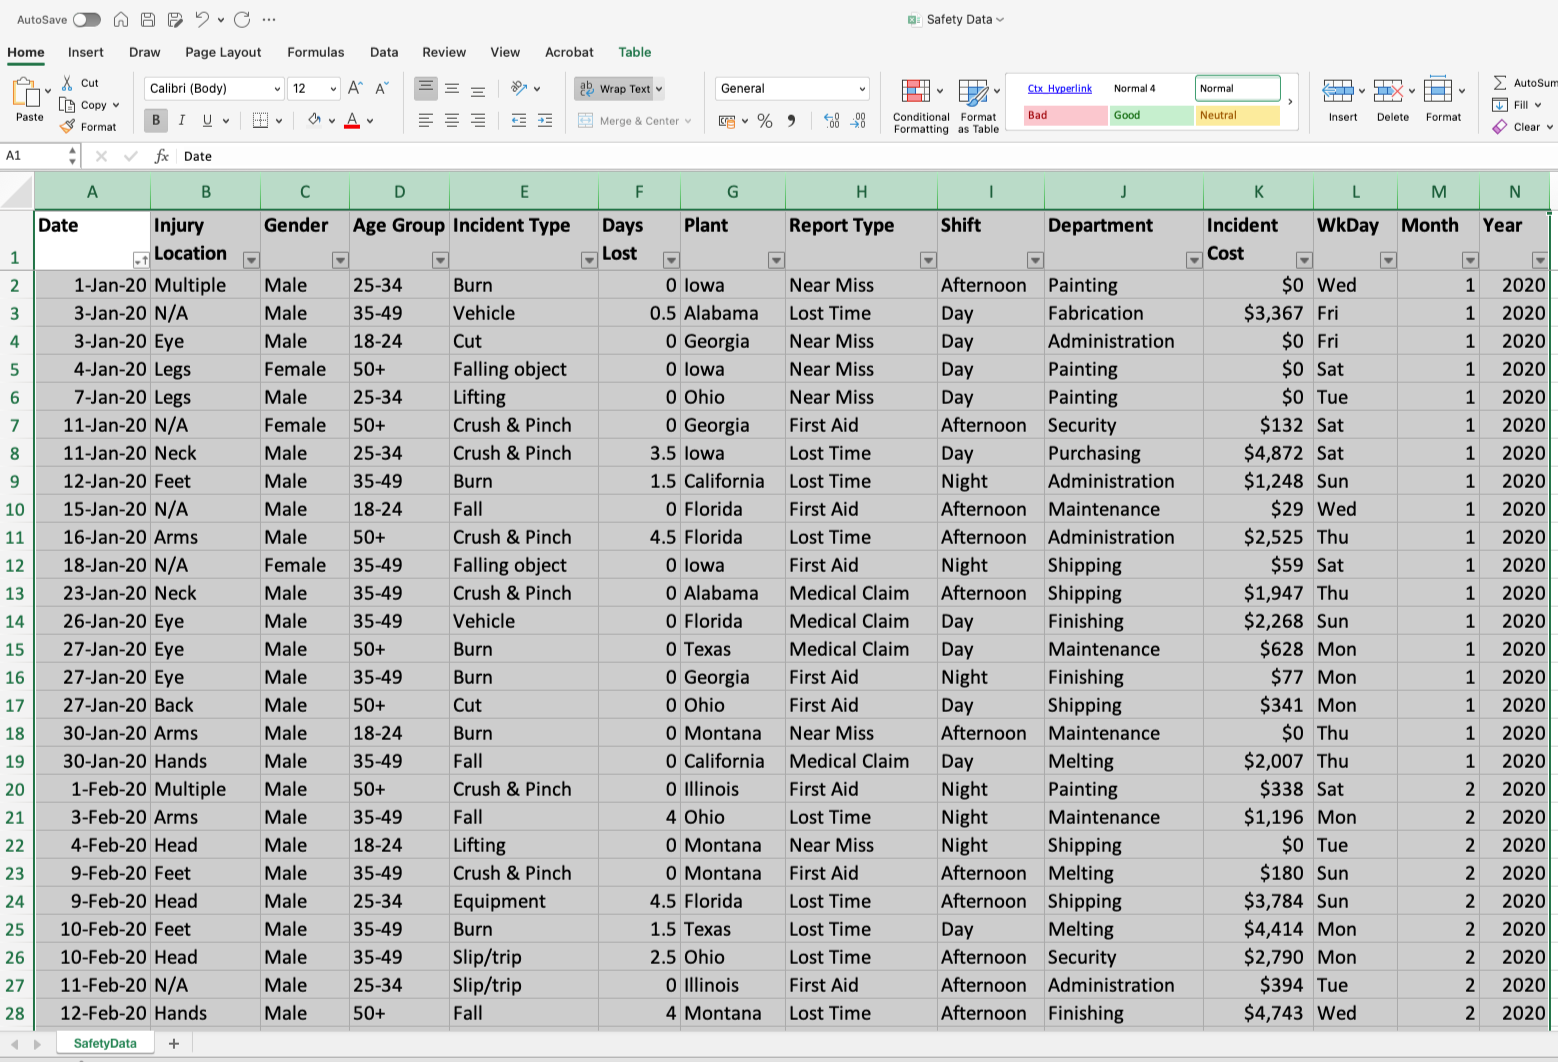
Select the data you want to create a pivot table with
Then select the "Insert" tab, and click on "PivotTable."

Select PivotTable from the Insert tab
Next, choose if you want the pivot table to be added to a new or existing worksheet and click on OK.
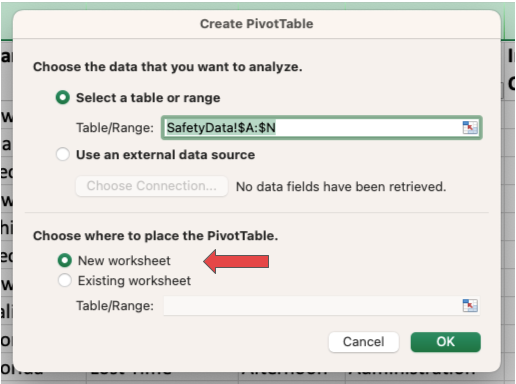
Choose whether you want your pivot table adding to a new or existing worksheet
Drag-and-drop fields into the "row labels" and "values" areas
Excel’s drag-and-drop feature makes it fun to build your pivot table. Just decide which data you want in your columns and rows and drag the field names into the respective sections.
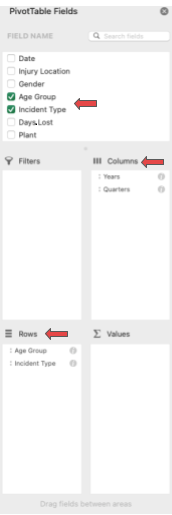
Drag fields into the columns and rows sections
Next, you have to decide which values you want to show for each column/row and drag this value into the values field.
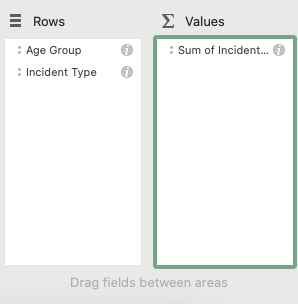
Drag the value field(s) into the Values section
Your pivot table will be updated in real time in the Excel worksheet.

As you build your pivot table, it’ll populate in real time
By default, Excel will summarize the data by either sum, count, or average depending on what type of data is in the values section. You can change this setting by right-clicking on the value name and selecting "Field Settings" in the pop-up menu.
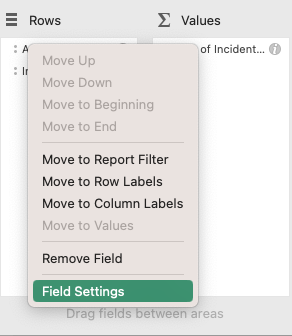
Right-click on the value and select "Field Settings"
Next, select how you would like the data to be summarized. For example, you could choose to show the average cost rather than the total (sum) cost.
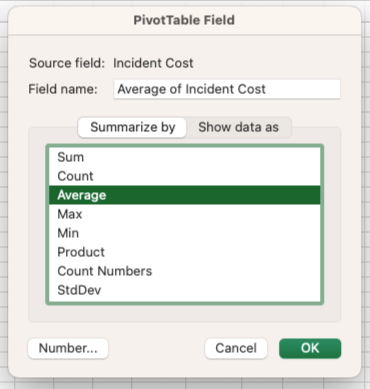
Select your summary method
You can then customize your pivot table by dragging fields around to generate the desired summary and breakdowns. With this flexibility, you can instantly create differently sliced views of your data and analyze it from varied aspects.
Sort your data by a specific attribute
You can sort your data per specific attribute by dragging a field name into the filter section of your pivot table setting. For example, you could show data only for a specific month, or for a certain product.
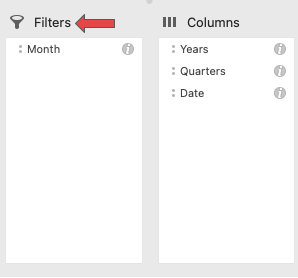
Drag the field name into the filter section
Excel will then add the filter to the top of your pivot table. Click on the arrow next to the attribute to sort your data.
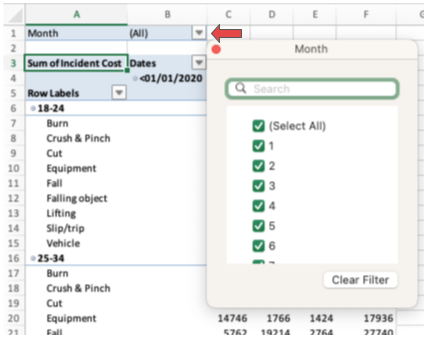
Click the arrow next to the attribute to sort your data
Key tips to get the most out of pivot tables
Data quality: The quality of your data plays a crucial role in the accuracy of your pivot table. Ensure that your data is accurate, complete, and properly formatted before creating a pivot table. Inaccurate or missing data can lead to incorrect results and impact the derived insights.
Field selection: Choosing the right fields for your analysis is important. Including irrelevant or unnecessary fields in your pivot table can clutter the analysis and make it harder to draw meaningful insights. Be selective and choose the fields that are relevant to your analysis goals.
Refreshing the pivot table: If your data changes or updates, it's essential to refresh your pivot table to ensure the analysis is up to date. Refreshing the pivot table updates the calculations and reflects any changes in the underlying data. Make it a practice to do this refresh regularly to maintain accurate insights.
Understanding data relationships: Pivot tables allow you to analyze and visualize data relationships. It's crucial to have a good understanding of the relationships between your data fields to accurately interpret the results. Consider the hierarchical relationships, such as parent-child relationships, when organizing your data in the pivot table.
Aggregation methods: Pivot tables offer various aggregation methods, including sum, count, average, etc., to summarize your data. When creating a pivot table, carefully select the aggregation method that best suits your data and analytical needs. As the choice of calculation impacts the summarized values, it's best to understand how options like sum, count, average, etc. will change your data’s meaning.
Formatting and layout: The appearance and layout of your pivot table can impact its usability and clarity. Pay attention to formatting options such as fonts, colors, and borders to make your pivot table visually appealing and easy to understand. Experiment with different layouts to present your data effectively.
Elevate your data analysis skills with pivot tables
By following the outlined steps, you can transform your raw data into organized and meaningful insights. Remember to consider factors such as data quality, field selection, and refresh the pivot table to ensure accurate results.
Expand your expertise in pivot table usage to become more proficient in leveraging data insights and drive informed decision-making for your business with these Capterra resources:

