Follow this process to improve your use of analytics and craft a compelling story with your data.
If you’re exploring deeper analysis of your marketing data for the first time, you’re faced with more questions than just how to parse the metrics:
Do you comb through past campaign performance?
What should you be tracking in the present?
How can you ensure what you’re doing has the greatest impact on future performance?
Answering these questions will help you tell a compelling story to organizational decision makers, improve your marketing efforts, and prepare for upcoming trends. This sounds like a tall order, but we’re here to teach you how.
Below you’ll find a five-step process for analyzing marketing data more effectively with technology, complete with insights from Gartner, survey data, and actionable tips to help you get started.
But first, what are the different types of marketing data?
Below is a brief overview of the different types of marketing data. For more details on the basics of marketing analytics and how they’re analyzed, check out our article What Is Marketing Analytics? Concepts to Build a Successful Marketing Engine.
Marketing data comes in several forms, and it’s important to know the differences. The three main types of marketing data are as follows:
Descriptive analytics: This process uses current and historical data to identify patterns, trends, and relationships between variables. This is the data used to prepare traffic and engagement reports and gain insight into consumer demand trends that affect your target audience.
Predictive analytics: This technique focuses on using market research to predict future marketing trends and scenarios, often being used for lead scoring and audience segmentation. With the help of machine learning, it can also be used to calculate customer lifetime value (CLTV).
Prescriptive analytics: While predictive analytics interprets the future using historical data, prescriptive analytics recommends actions that you should take to affect those future outcomes.
Understanding the basics when it comes to what data you’re collecting and its practical purpose is the foundation of our process. Now let’s dive into the rest of the steps so you can get the most out of that data.
Our lists of marketing analytics companies by location can help you find the services you’re looking for.
Step 1: Define the most important key performance indicators (KPIs)
You can have all the data in the world, but if you’re not focusing on the right KPIs? Your data will fail to tell a compelling story when it comes to your marketing goals. Plus, focusing on specific KPIs serves as a north star for your everyday marketing efforts. It’s easy to know you’re making progress when you’re tracking toward a select few goals.
/ How do I get started?
In short, choose KPIs that ladder up to your organizational goals. Gather your marketing teammates and have a refresher on your short, medium, and long-term goals as an organization. Keeping them in mind throughout the process acts as a source of truth.
For example, if you’re a nonprofit working to increase overall donations, tracking clicks to a donation landing page from your various marketing channels is an appropriate main KPI. If you’re launching a new product or service, tracking engagement and sentiment around your promotional content is likely the option for you.
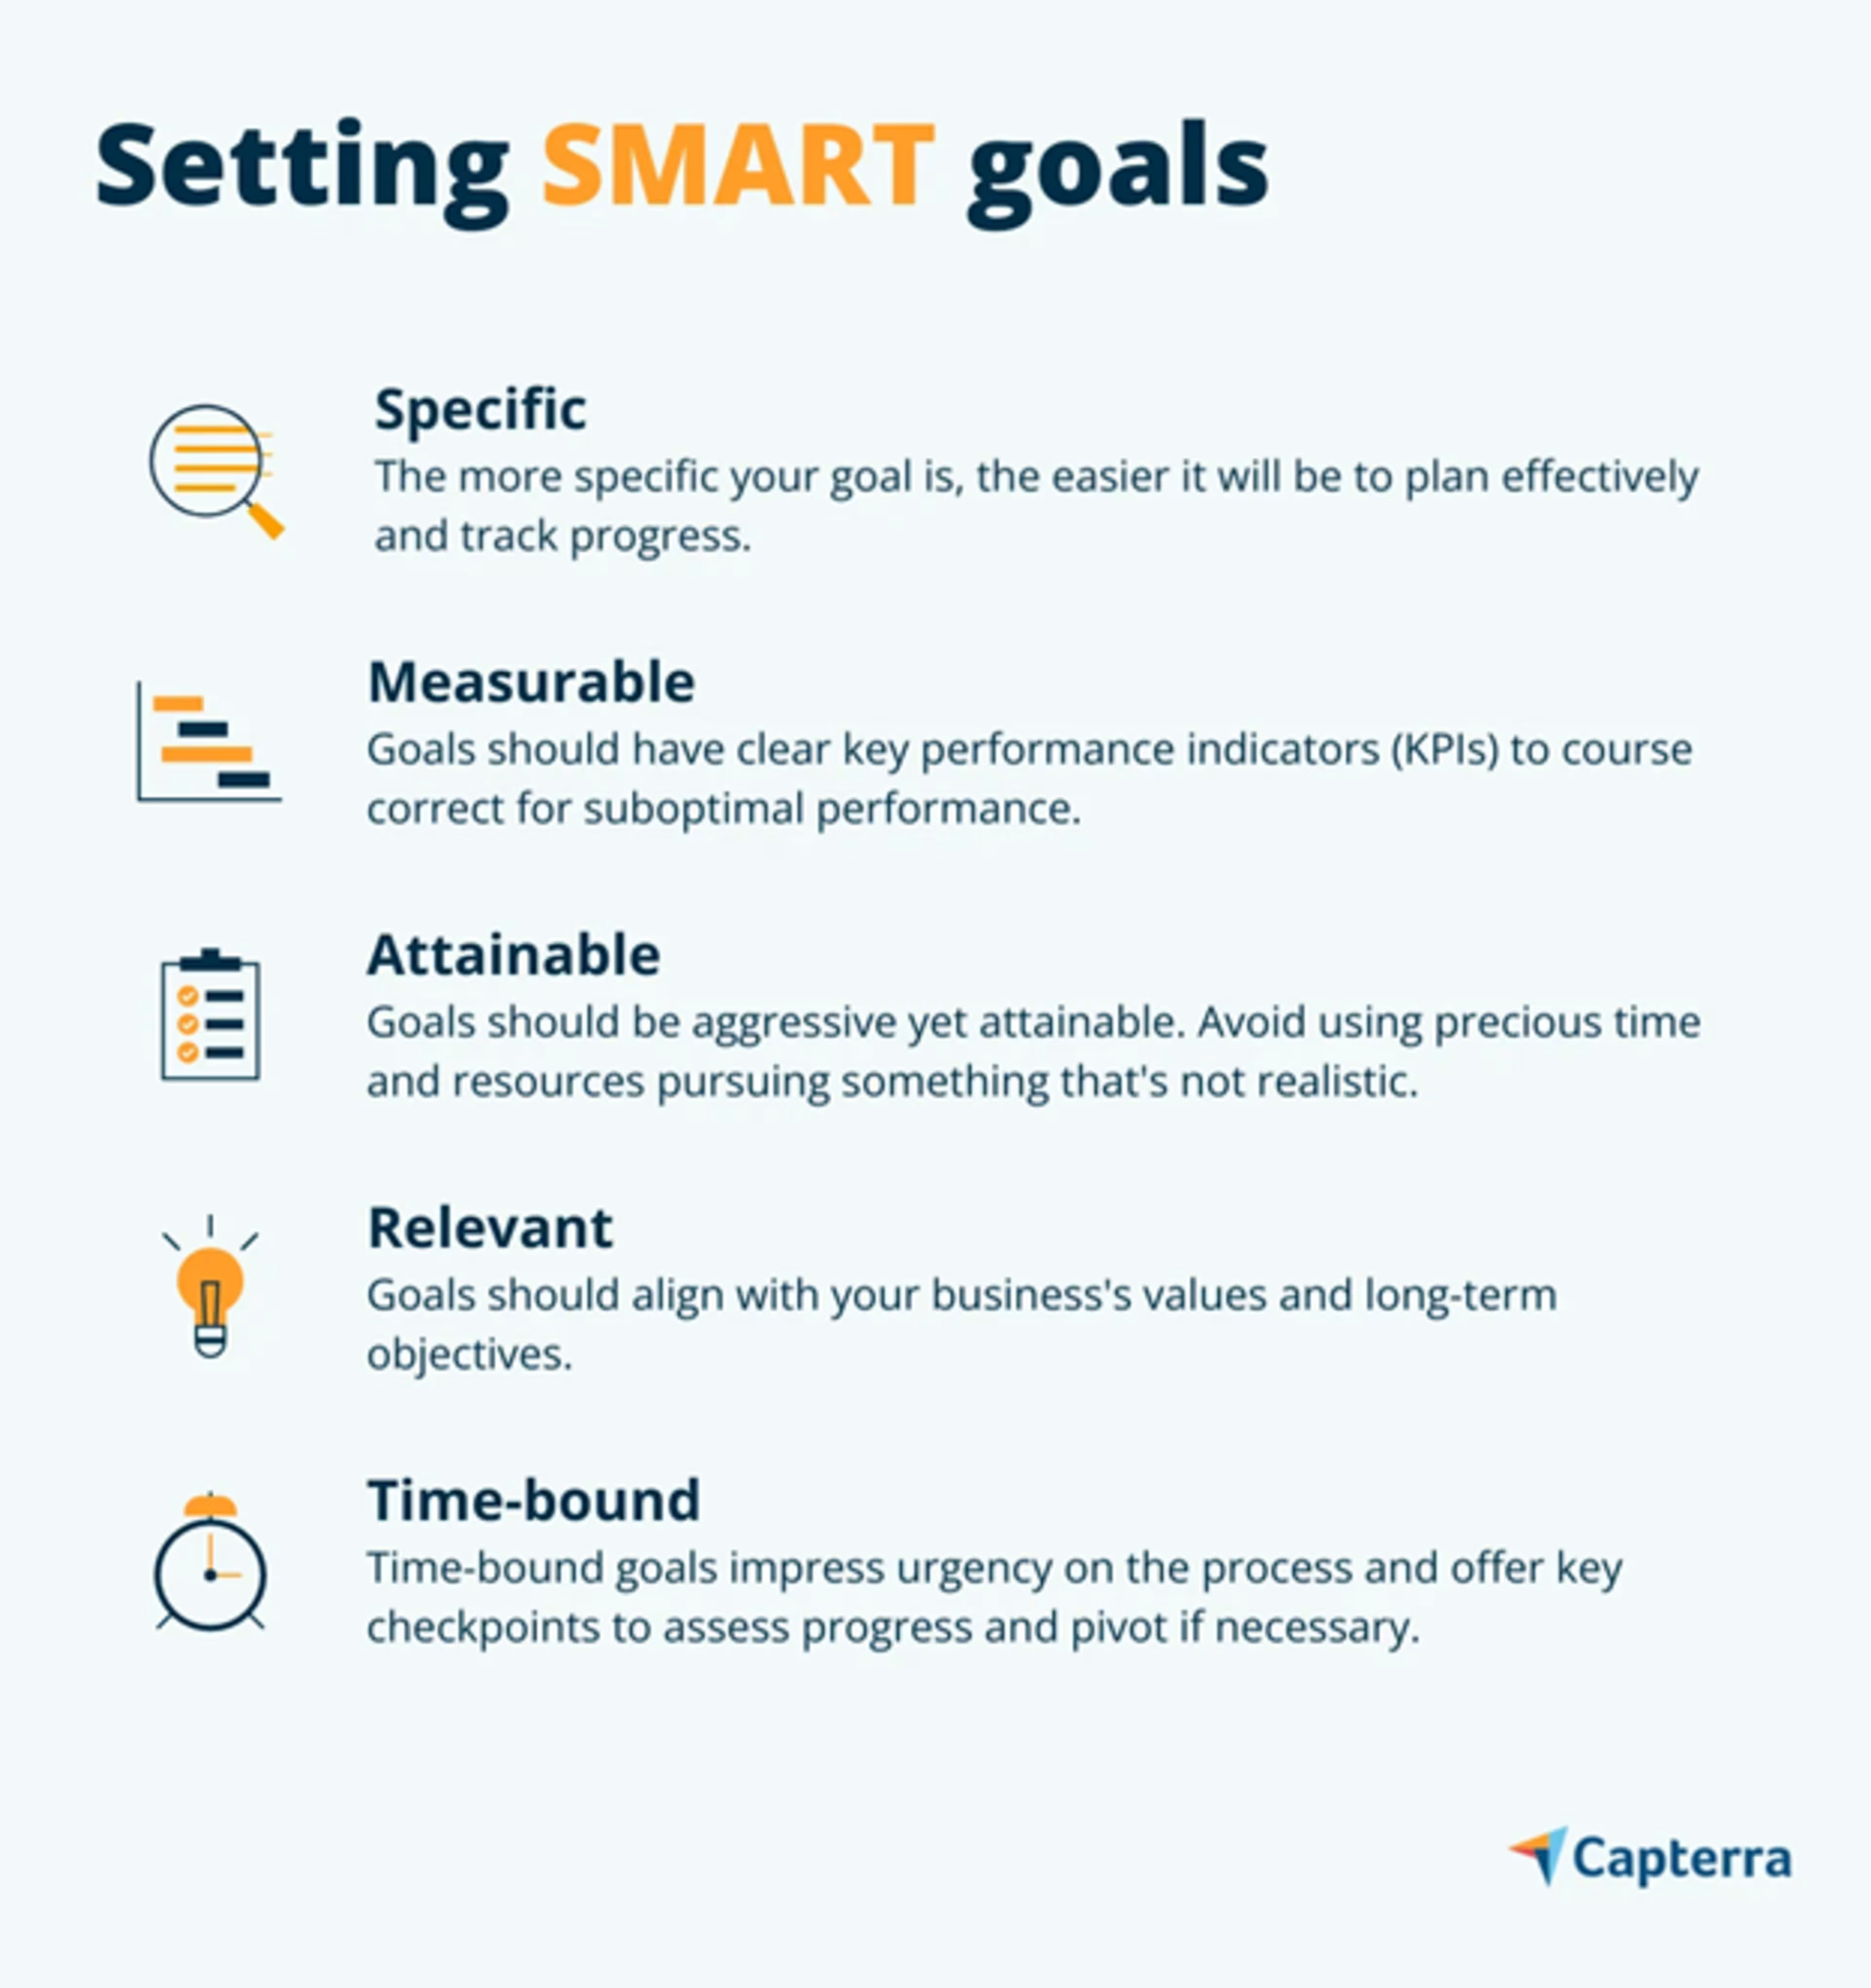
Whatever the case may be, choose 1-3 main metrics that speak specifically to your business goals. As an extra aside, make sure your goals are Specific, Measurable, Attainable, Relevant, and Time-bound.

Need a refresher on SMART goals? There’s a section on just that in our article How To Launch a Product in 7 Steps.
Step 2: Explore your data
A major step in improving your use of data analytics is to first determine what data you currently collect and where it’s stored. Do you manage your data in spreadsheets? Do you have dedicated marketing analytics software? Do you rely on analytics features from more general tools like your CRM platform?

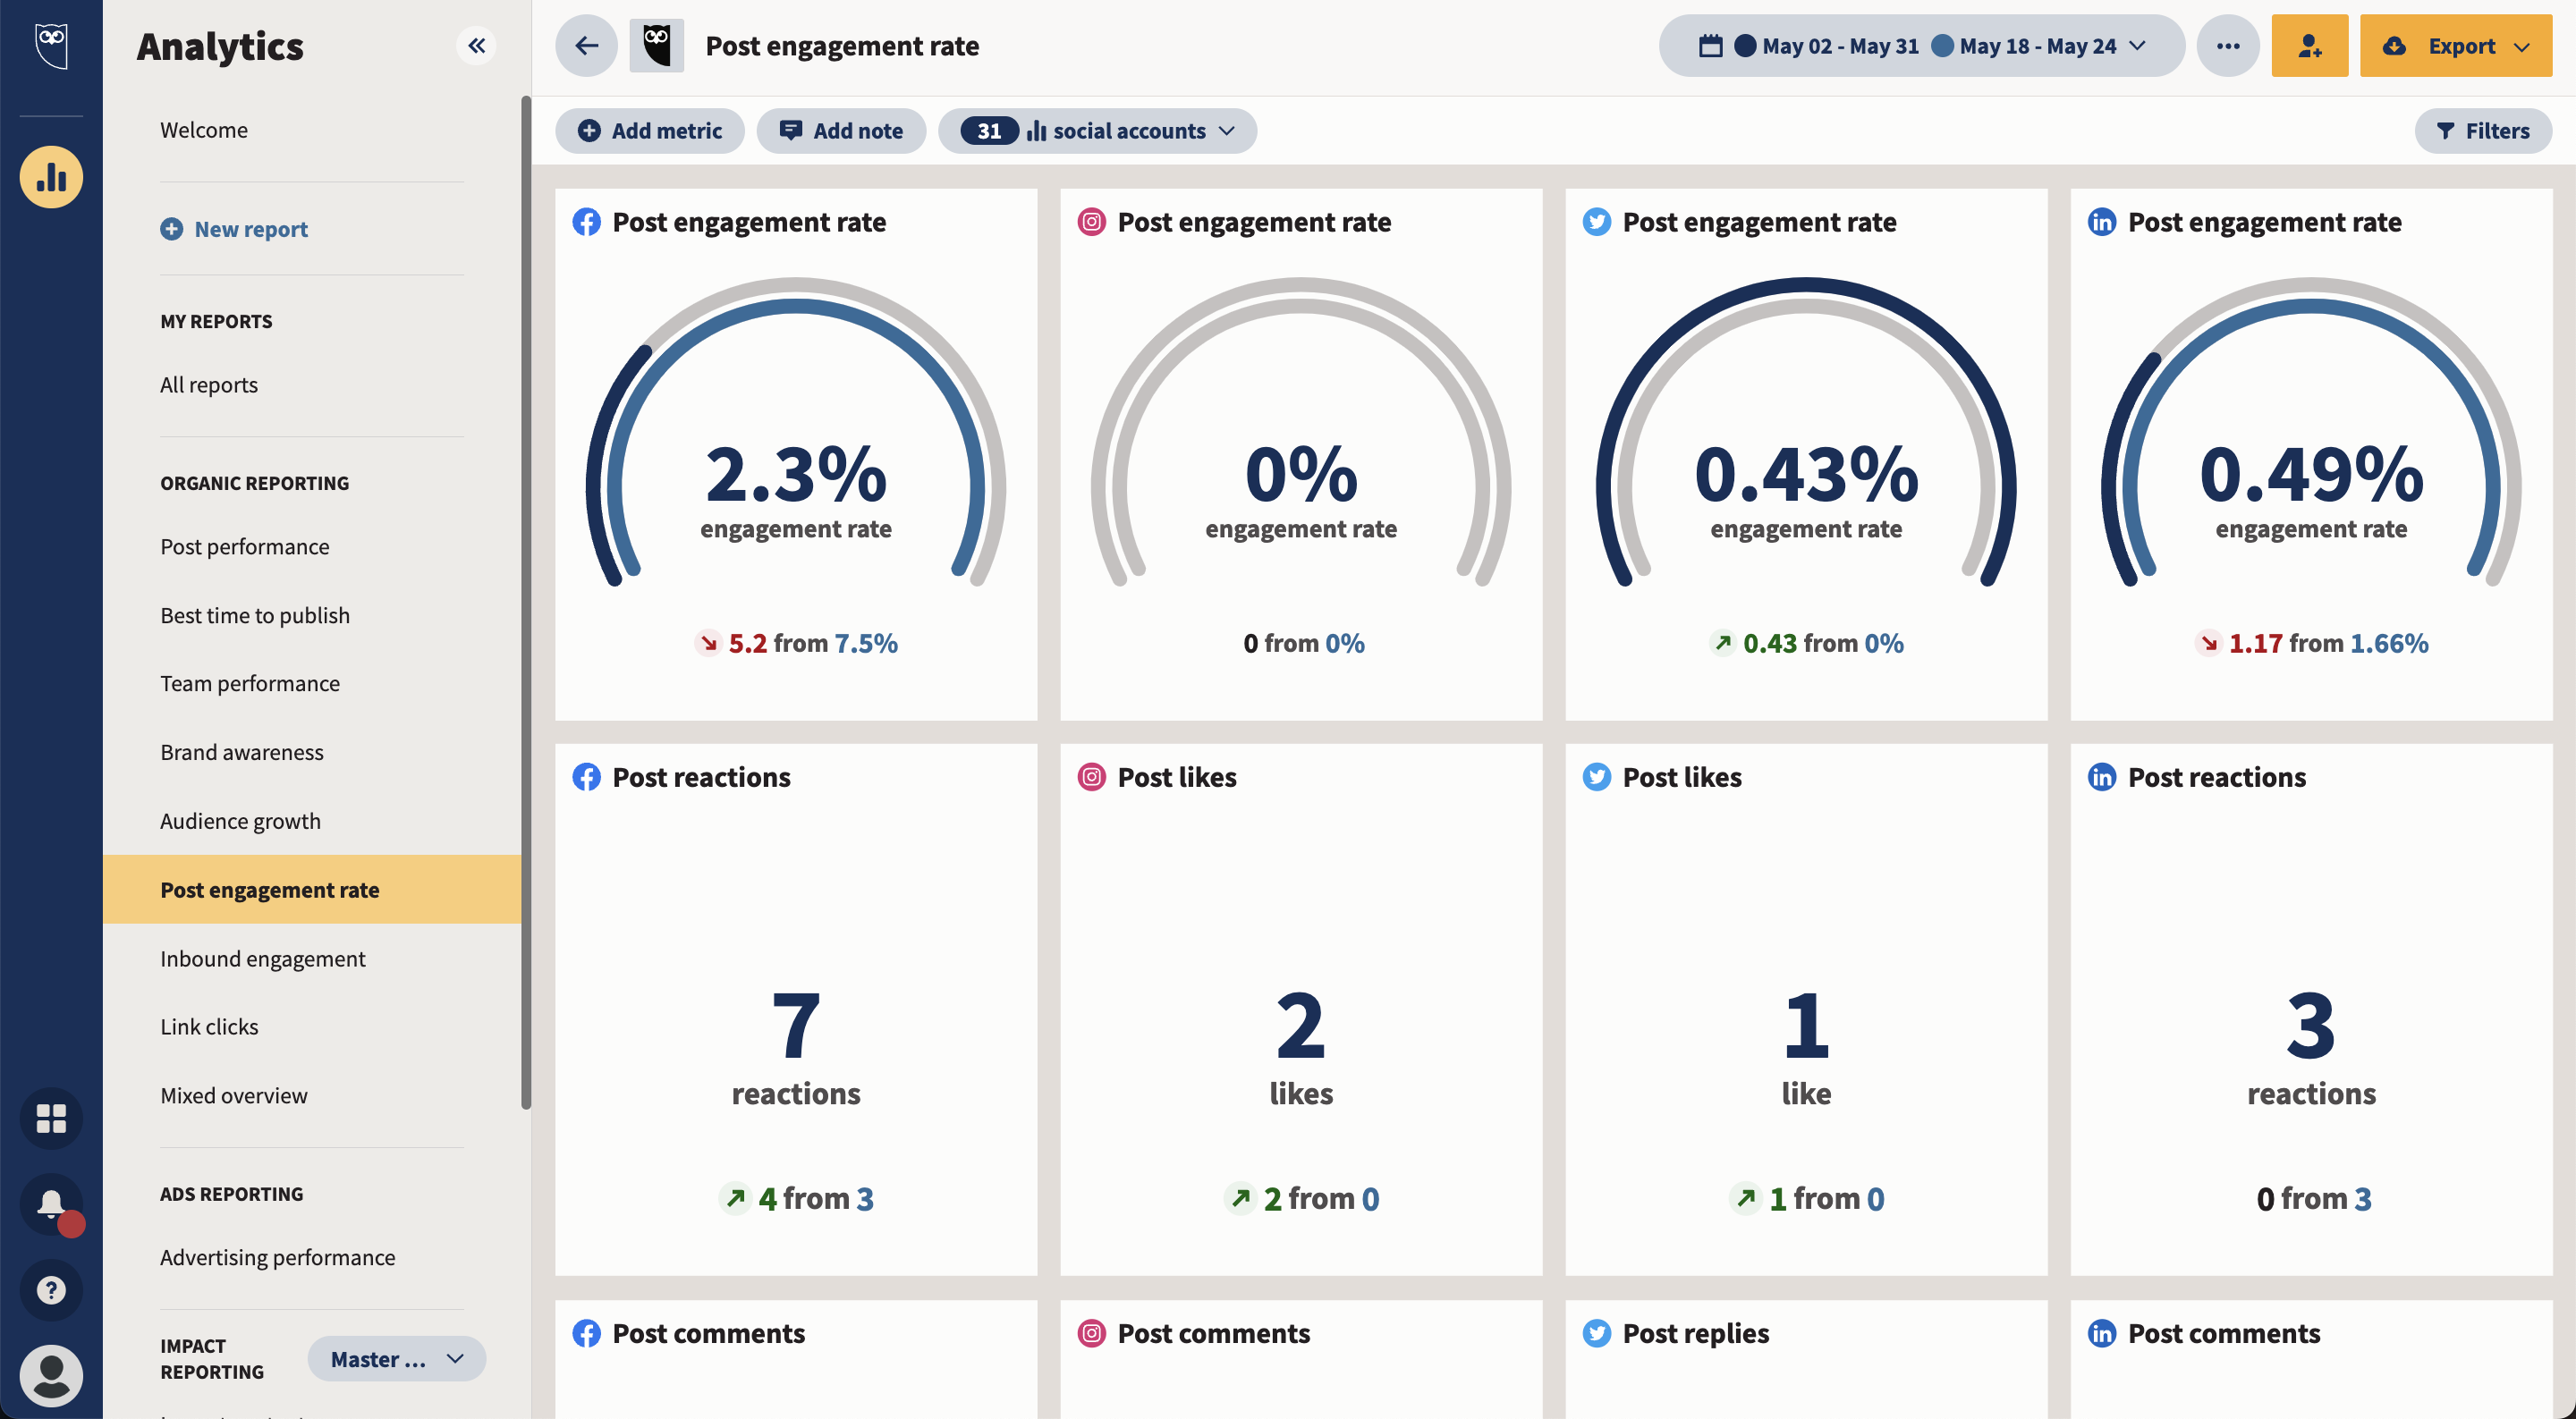
An example of a social analytics dashboard from Hootsuite (Source)
/ How do I get started?
Access your analytics tools and discover the areas where you spend the most time, features that could be used more, and any potential pain points with your current system. This is a great opportunity to reframe processes in small ways that can have a big impact.
Whatever the case may be, how you process first-party data—that is, the information you yourself collect about your customer behavior—will be instrumental in optimizing your long-term marketing strategy.

This is due to the fact that the nature of third-party data—data collected by aggregators and delivered to you in some form of dataset—is fundamentally changing. This makes first party data and what you’re able to do with it more important than ever.
When you’re first getting started, it’s a good idea to focus on descriptive analytics as they are readily available in any marketing analytics tool and offer a good view of how your current efforts are performing. There’s no need for advanced analysis at this stage, instead focus on collating the info you have and comparing it against the goals you established in Step 1.
For more on the four types of customer data and how you can improve your strategic use of first party data, visit our article Improve Your First-Party Data Strategy—Our Research Shows You How.
Step 3: Note data trends and identify areas for improvement
Now that you’ve realigned on your goals and have a good sense of what data you currently have access to, you’re ready to enter the main arena of data analytics: the analysis itself.
Undergoing this process will lead you to discover powerful, business-specific insights within your data. But how do you determine their impact? There are two steps you can take to do so, and you’ll soon see that the true value of marketing analytics is greater than the sum of its individual components.
First, identify the impact category for each initiative.
The three main impact categories identified by Gartner are as follows [1]:
Operational efficiency
This category refers to initiatives that help with day-to-day marketing activities, including things like KPI standardization and cross-channel dashboards. This manifests itself in time saved by your marketing team.
Marketing contribution
This category refers to initiatives that impact the mix of your marketing modeling and delve into the predictive analytics discussed earlier. Essentially, initiatives that make a specific and measurable impact on your overall marketing efforts measured in dollars saved or earned.
Business transformation
The third category is reserved for analytics initiatives that have an outsized impact on not just your marketing efforts but your business as a whole. This includes embarking on entirely new methodologies informed by analytics or cross-departmental collaboration opportunities that are measured by expansion in distribution, customers, and entire markets.
Second, measure both the primary and secondary impacts.
Primary impacts directly relate to the original purpose of any given initiative:
Operational efficiency initiatives save time.
Marketing contribution initiatives reduce spend as it relates to media planning.
Business transformation initiatives activate new channels, customers, and sometimes entire markets.
Secondary impacts stem from the above primary impacts, typically resulting in a change that’s larger in scope than primary impacts:
Increased operational efficiency creates the opportunity for new marketing initiatives. The secondary impact then becomes the value of those new initiatives.
Marketing contribution initiatives free up budget to be spent on other areas. The secondary impact is the result of activities made possible by budget reallocation.
Business transformation initiatives help activate new channels, customers, and markets. The secondary impacts are the value of increased business resilience and the cumulative value of other incidental changes along the way.
Of course these impacts are hopefully positive, but on the flipside, you may also discover areas for improvement—a marketing channel that doesn’t perform as well as you’d hoped, a type of social media content that doesn’t resonate with your customers, or an email marketing tactic that renders your messages undeliverable by email clients like Gmail and Apple Mail.
Predictive analytics tactics are particularly helpful here as you begin to map out customer segmentation and opportunities to increase customer lifetime value. Focus on where your customers are spending their time online and work to increase outcomes on the most popular channels.
/ How do I get started?
Take note of which KPIs are excelling and which need some help. Do this by comparing past and current performance against your goals. Make sure to assess the data channel by channel, especially for social media content where you may post similar messages on multiple platforms.
These insights are what will improve your outcomes, but it’s not always easy to bridge the gap between analysis and action. In fact, according to Gartner, nearly three quarters (73%) of marketing analytics team members and leaders agree that they would utilize marketing analytics in more decisions if the quality of analytics’ output were improved[1].
So, how do you improve the quality of your analytics output? Enter data visualization.
Step 4: Use visualization tools to tell a compelling data story
The importance of effective data visualization cannot be overstated. In fact, according to Capterra’s 2022 Data Visualization in Marketing Survey*, 92% of marketing decision makers could make better decisions in their daily work if they had a well-designed presentation of marketing data.

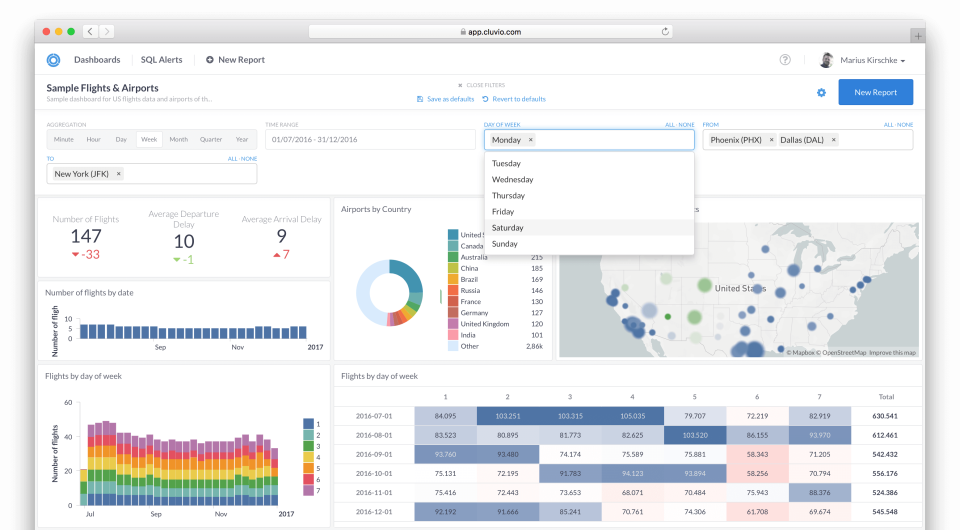
An example of a data visualization dashboard from Cluvio (Source)
Generating reports that are easy-to-understand and visually appealing allows marketers to deliver information to leaders and decision makers in a way that not only looks good but tells a compelling story.
Gartner asserts that marketing analytics teams often focus on insights that help quantify the impact of specific initiatives but are not as versed in tying outcomes to broader organizational goals [1]. This is where data storytelling comes in.
/ What is data storytelling?
Data storytelling is the process of crafting a compelling narrative based on data and analytics that help tell your story in order to inform or influence a particular audience.
In order to tell a compelling story to your decision makers, Gartner recommends three things:
Speak their language: Not every leader “speaks data.” Convey the most important points using high-level language that’s easy to understand.
Listen actively: Hear and internalize your leaders’ concerns so your data-driven recommendations can proactively address them.
Empathize with their perspective: Not all leaders are well-versed in marketing or data. Try to understand problems and potential solutions from their perspective to increase the chances they will take your recommendations.
/ How do I get started?
Assess the features currently available to you. Focus on reporting functionality and familiarize yourself (and teammates) with ways to enhance your current reporting process. Consider meeting with software partners to discover underused capabilities or conduct training sessions.
Step 5: Have a process for managing your data
You’ve hit the ground running with analyzing your data, found the features and tools that work for you, and are learning to tell a compelling story to leadership. Now is the time to ensure your new and improved strategy is sustainable for the long haul.
Establishing a solid data governance process will help you do this. Put simply, it’s a best practice to designate someone that’s responsible for keeping track of your data, integrating it with third-party software, and acting as a point person for internal reporting. Most commonly this person will be a marketing leader, a data specialist, or a marketer such as yourself.
As a small business you may not have a data specialist on hand, and one excellent option to combat this is to expand you and your teammates’ expertise in the area. After completing these steps, you know what data is important to communicating your results and you’re familiar with your tools. Treat this as an upskilling opportunity and go to town!
/ How do I get started?
Determine who on your team will become your point person for all things marketing data. Have conversations amongst your group to gauge interest then go from there, making sure the person you choose has a grasp on reporting best practices and is comfortable in your analytics tool.
Capterra tools & tips: Making the most out of your data as your business scales
It’s possible that you don’t have a large enough team to dedicate one person to data governance. Or you may be growing at a pace where you need some extra help to make sense of it all. That’s ok! In that case, it may be a good idea to explore the option of hiring a marketing analytics service.
An analytics service can bring you and your team up to speed on best practices, generate ongoing reports, and help with the strategic implementation of your marketing data. This can be a project-based relationship or ongoing depending on your needs and resources.
For more info on how to choose an agency partner, check out our article 4 Key Considerations to Help You Choose a Digital Marketing Agency.

Going from merely collecting data to having a full-fledged data analysis framework isn’t easy. Armed with this 5-step process, however, and you’re more than prepared to meet the challenge. Improving your use of tools, developing your expertise, and learning how to communicate data analysis to key decision makers will ensure your recommendations and marketing efforts are taken seriously.
For more on data analysis and digital marketing in general, visit the Capterra blog:
Why CRM Implementation Can Be a Challenge for All Businesses
Online Marketing for Small Business: Strategy Tips From Successful SMBs
Improve Your First-Party Data Strategy—Our Research Shows You How
Note: The applications selected in this article are examples to show a feature in context and are not intended as endorsements or recommendations. They have been obtained from sources believed to be reliable at the time of publication.
