If you're thinking of buying business intelligence (BI) software, you may be unsure of which features you need and which ones you don't.
If that sounds like you, you're not alone; there are many, many options available when it comes to BI software. Depending on your needs, you may opt for something that's no-frills with basic capabilities, or you might choose an advanced platform with more specialized functions.
But how do you differentiate the basics from the more niche offerings and avoid buying features you don't need—or missing out on the ones you do? In this article, we're breaking it all down for you.
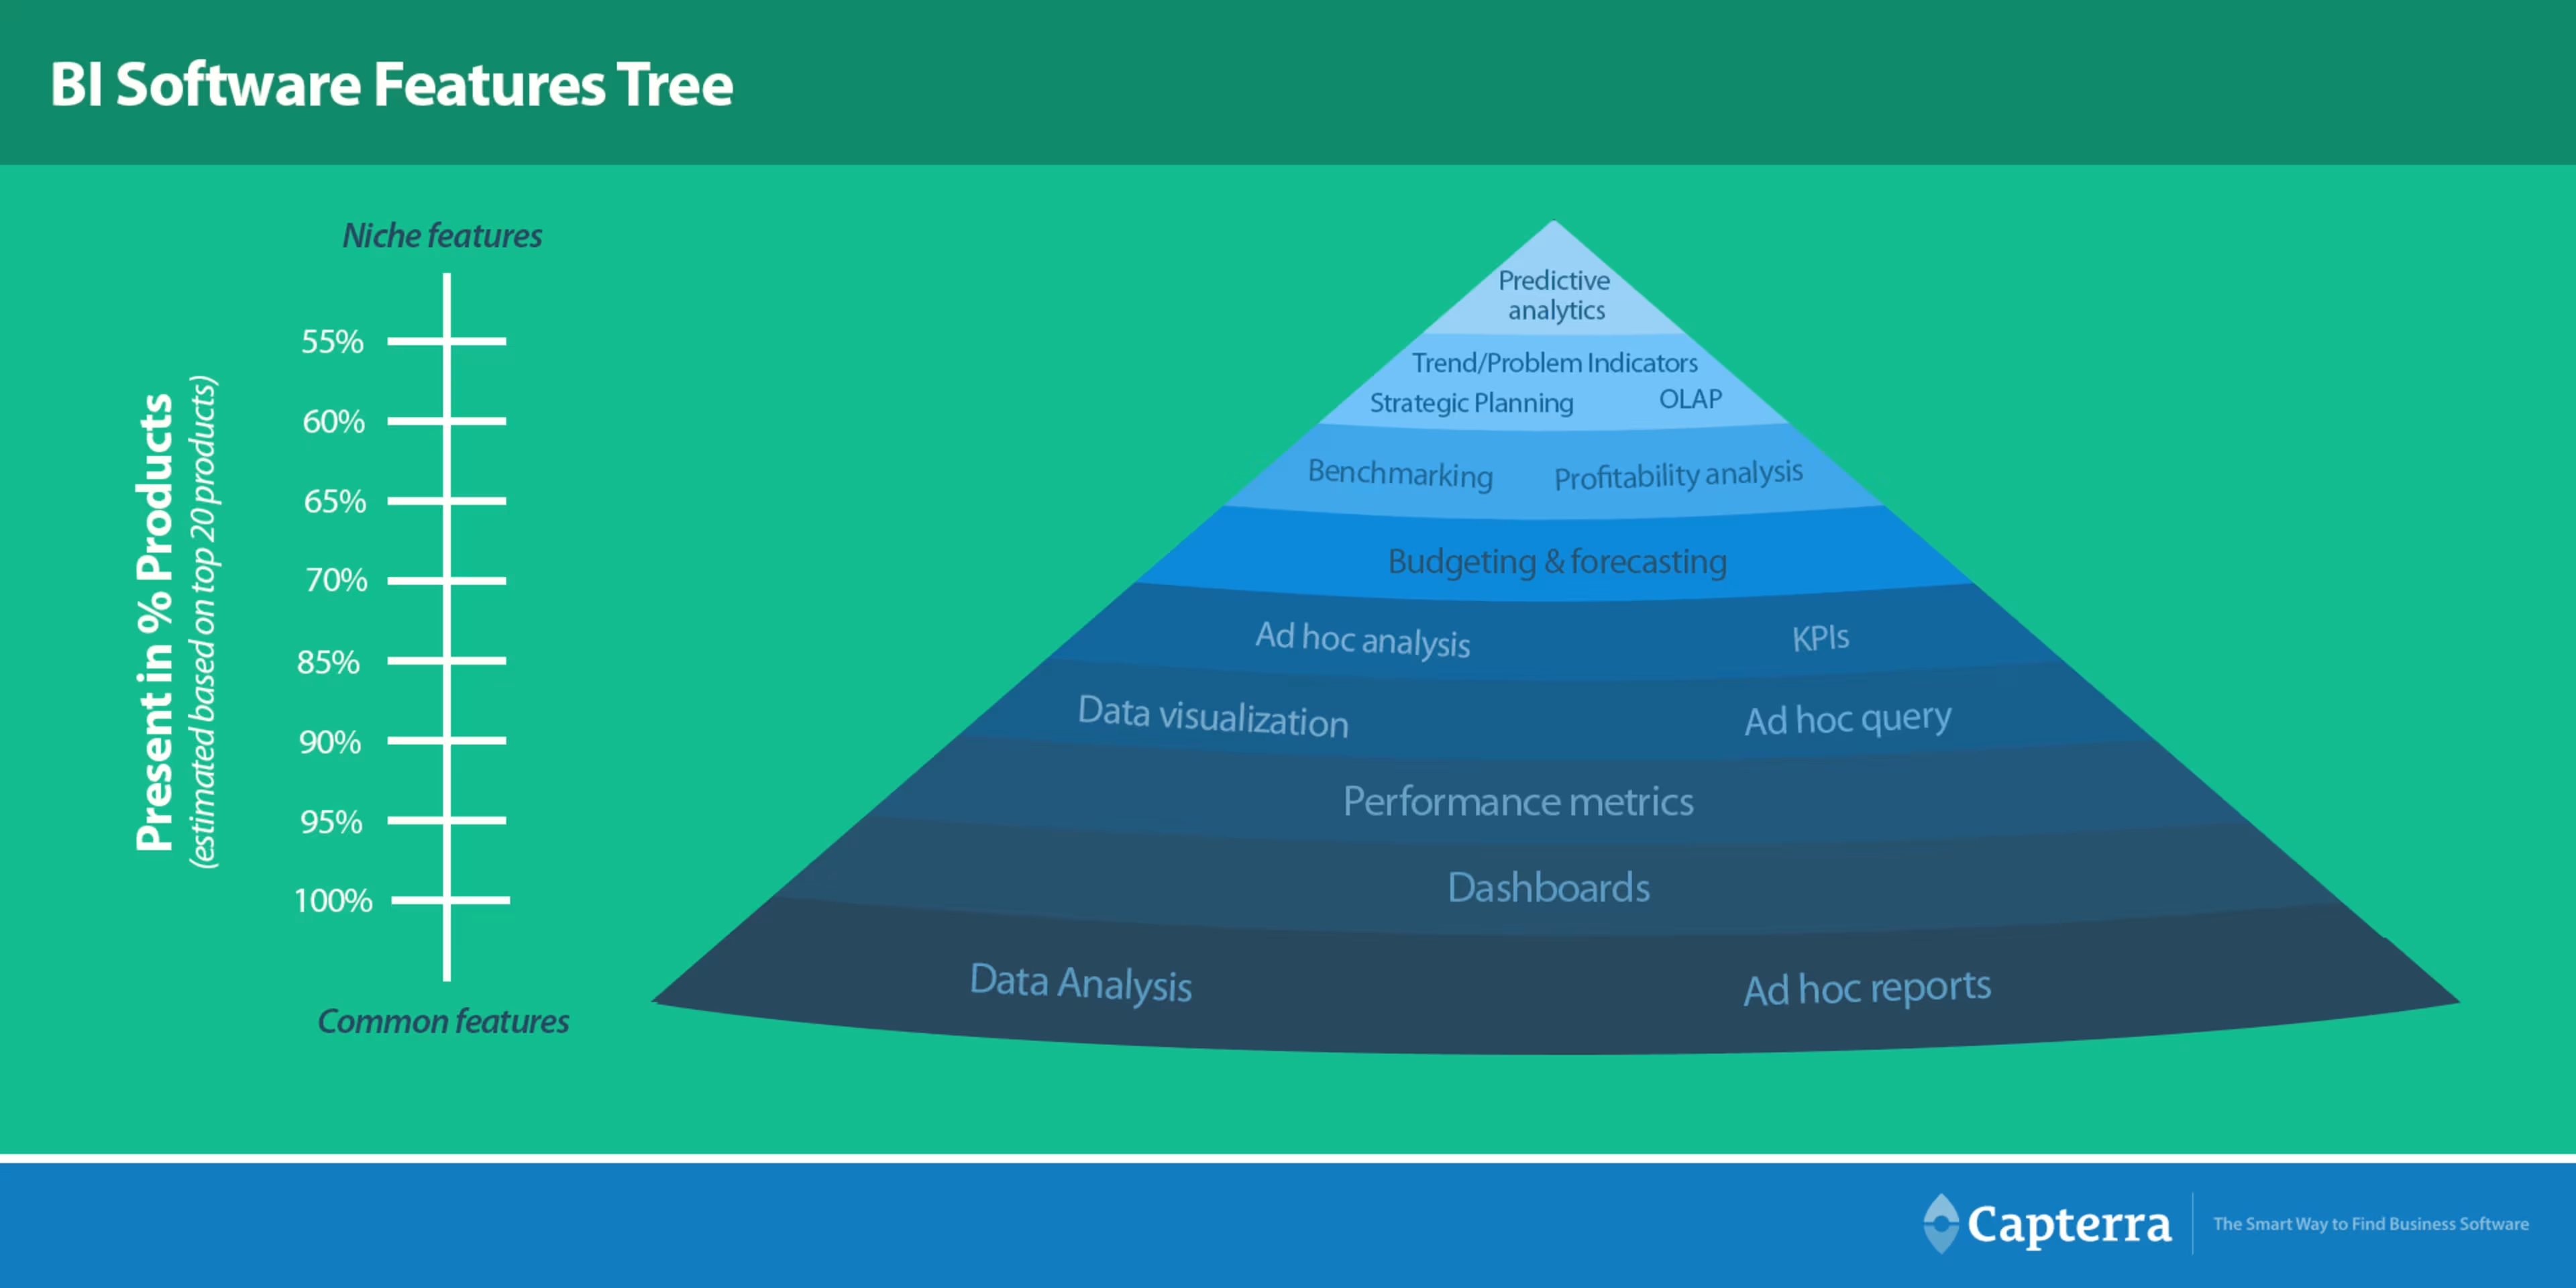
Based on the features offered by the products included in Capterra's Shortlist report, we've created a BI Software Features Tree, which identifies the most commonly needed features, as well as the more specialized ones. We're also looking at a few real-world examples to demonstrate how these different BI features could help your business.
Once you know which features you need, the next step is to select a BI platform that most closely aligns with your needs. So you don't have to go hopping from one page to another to compare BI software, we've also provided a BI Features Checklist with a graphical view of features offered by the top BI products, as listed on Capterra.
Streamline your software search with our Shortlist guide
Quickly find the right tool with this snapshot of the most popular Business Intelligence Software

BI Software Features Tree
Our BI Features Tree presents software features based on how common they are in the BI products we're looking at. The most common features are listed at the bottom, and the more niche ones are listed at the top.
The most common features—data analysis and ad hoc reports—are offered by every product on Capterra's list of the 20 most popular and are required by more users. Predictive analytics, on the other hand, is offered by 55% of the products on the list, and would most likely only be required by more advanced users.
BI Software Features Tree
The basics: Most common BI features
You probably started your business intelligence journey using Excel spreadsheets. And, at the time, spreadsheets were likely sufficient for building simple dashboards and charts to give management an overall view of business metrics such as sales, revenue, costs, and headcount.
But as you grow in size and revenue, so does your data. You may even find that your Excel sheets get hung up as your data grows in volume. As a result, your dashboards take more time to update and sharing large files become difficult.
If you've reached that point, now may be the right time to move to a dedicated analytics solution such as QlikView, Tableau, SAS, or Domo. These BI tools provide the most common features, including: data analysis, data visualization, ad hoc analysis, dashboards, ad hoc query tools, ad hoc reports, KPIs, and performance metrics.
While some of the above features may sound similar to the capabilities of an Excel sheet, they differ in some important ways, for example:
The scale and usability of these functions is much greater in a dedicated BI software platform; BI tools are capable of handling huge data volumes without errors.
They let you work with dynamic real-time data and offer a wider range of data visualization options, including heat maps, sparklines, geographical mapping, and spider charts.
The reporting and dashboard capabilities of BI solutions are far more interactive than those of MS Excel.
In addition, most of the common features offered by BI solutions are easy to use and do not require any specialized IT expertise.
Let's look at some examples of these more common BI software features and how some real-life small businesses moved from Excel spreadsheets or manual methods to an analytics tool to take advantage of them:
Reports and dashboards. Fiverr, an eCommerce marketplace was having difficulty managing scattered data from multiple sources. The company's existing tools couldn't process real-time website data, and its report building functions depended on IT developers.
Fiverr adopted Sisense, which helped the company create interactive dashboards that automatically refreshed to provide real-time data on changing market conditions, as opposed to static dashboards. The reporting features in Sisense enabled employees to easily create reports using drag-and-drop options. The software's ad hoc query feature helped Fiverr handle multiple concurrent queries on large complex data sets and reduce refresh rate times.
Data analysis. Big Brothers Big Sisters of America, a nonprofit organization, was using a combination of manual methods and patched-up old systems to analyze funding data. This often led to errors and wasted volunteer time.
It turned out the nonprofit could perform faster and more accurate data analysis using QlikView. The platform's data analysis and dashboard capabilities helped the organization unify data sources, improve analysis, and receive alerts about errors.
According to Brian Moffo, director of business intelligence for Big Brothers Big Sisters of America, “Our input systems didn't talk to one another. We wanted to build a unified data warehouse system with solutions that could sit on top of older systems. We didn't want to have to rebuild everything, but rather just take the data as it was."
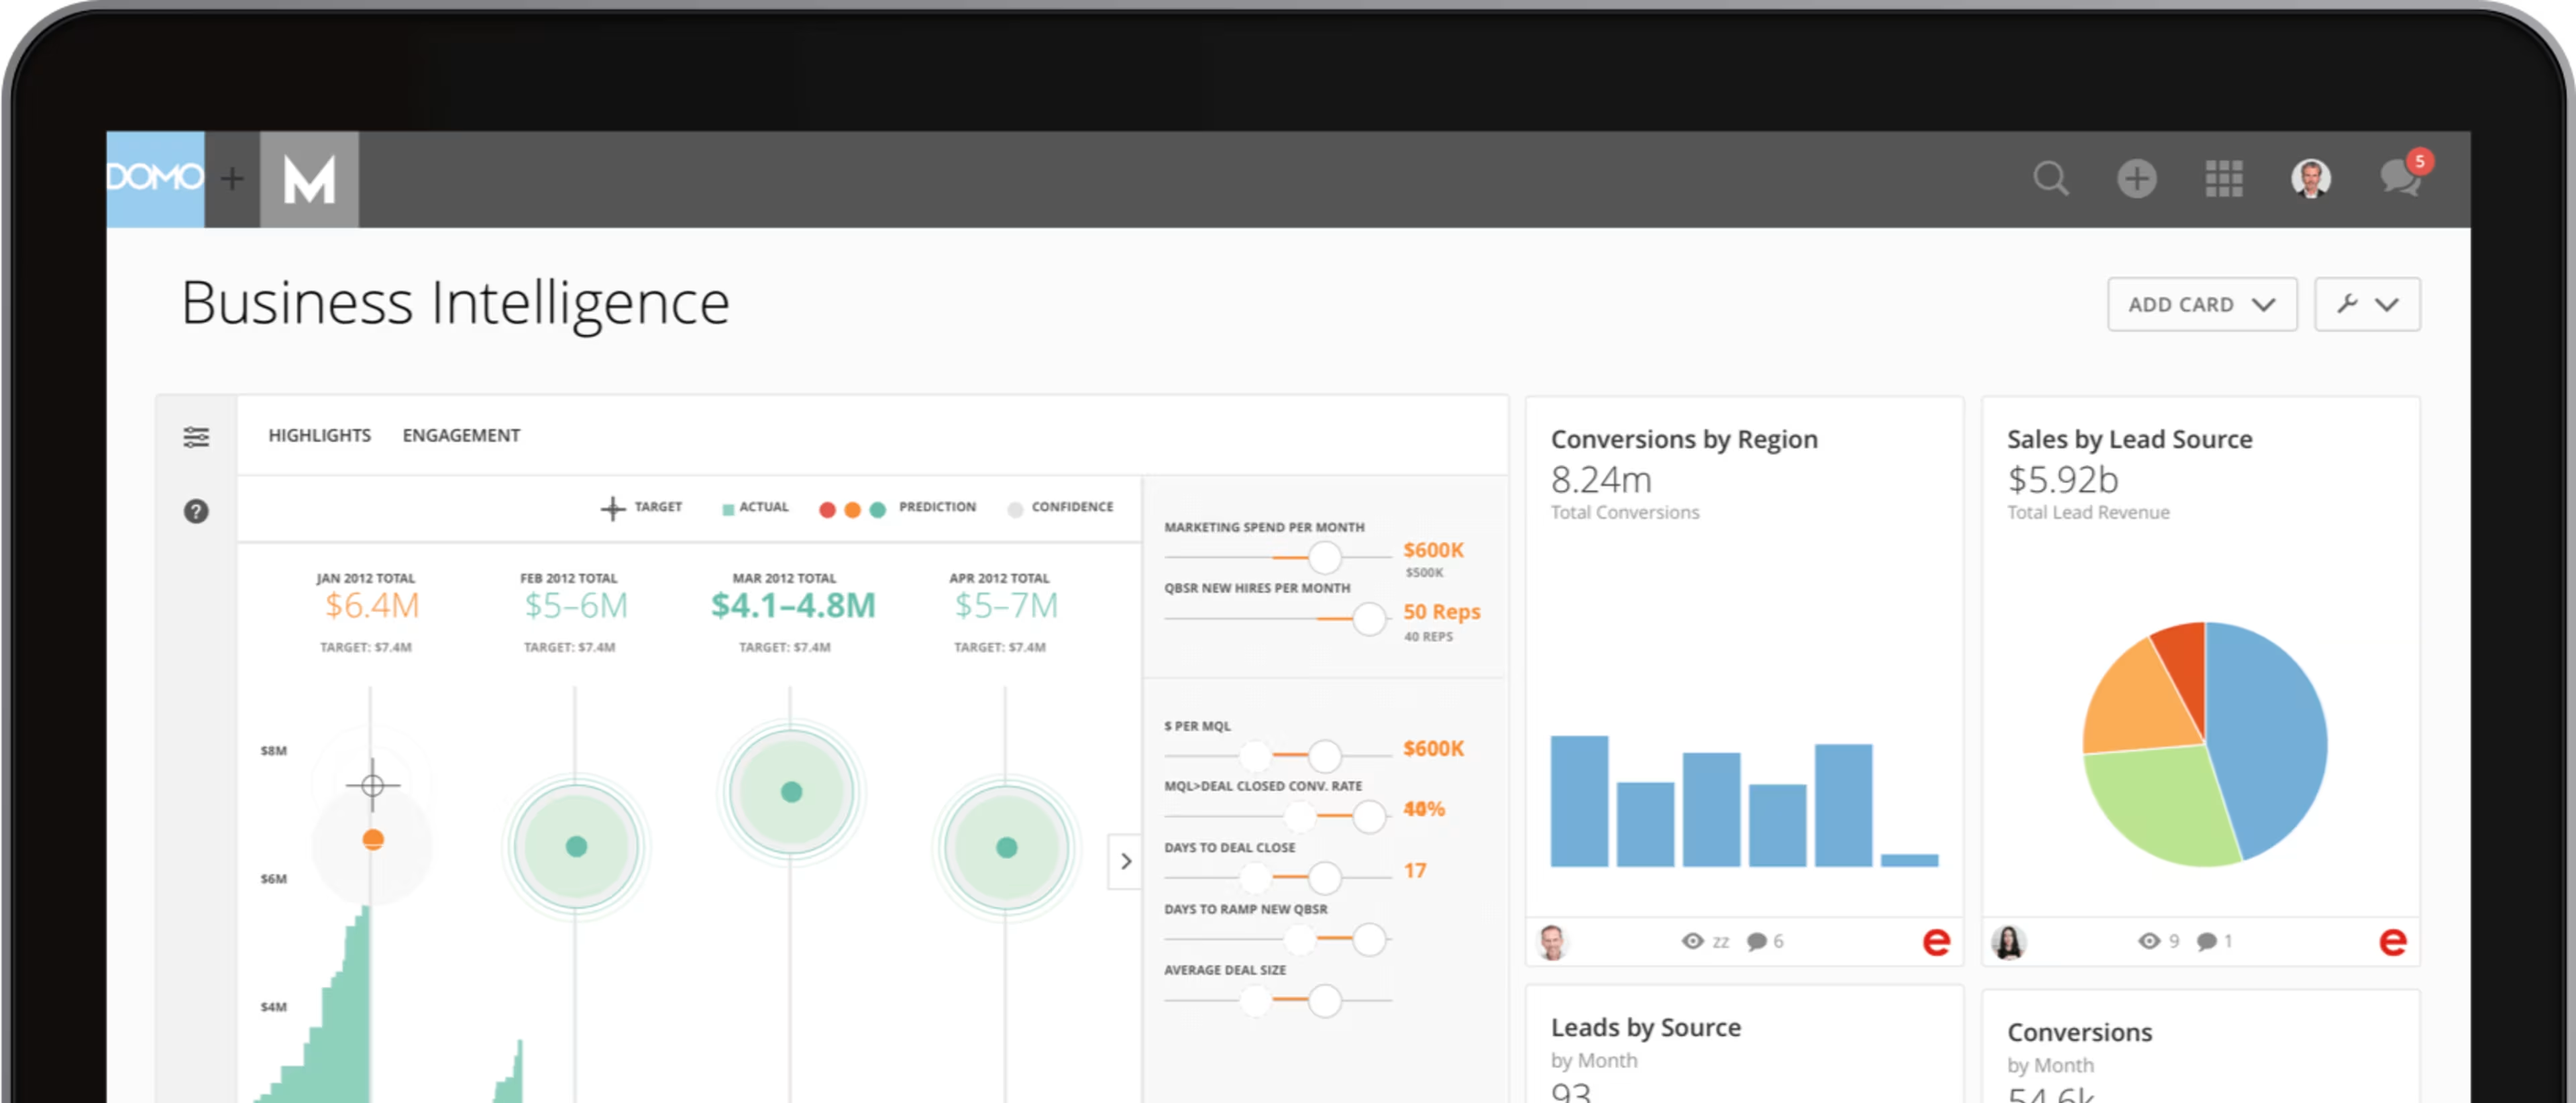
KPIs and data analysis. Xactly, a technology vendor, reduced manual efforts and saved time by implementing Domo for data modeling and analysis. Domo's data analysis features helped Xactly save 20 to 30 hours a quarter, allowing the organization to concentrate on more high-value tasks. The software's data visualization and KPI functions enabled Xactly to generate valuable business insights in less time.
Screenshot of Domo's BI dashboard feature
Painting a black-and-white distinction of “common versus niche" features is difficult, because features such as budgeting and forecasting, profitability analysis, and benchmarking fall toward the middle of the tree. These features are not as widely used as the common features, but we can't classify them as niche features either, as many firms embrace these functions, though they may seek separate tools for them.
If multiple tools isn't in your budget, but you want to add on one or more of the midrange features, prioritize the features you do need, and go with the solution that most closely fits your needs and budget.
You can use our BI Features Checklist below to shortlist the products that best suit your needs.
Getting more advanced: Niche BI features
If terms such as “predictive analytics," “OLAP," or “trend indicators" intimidate you, it's likely because they're not your everyday BI concepts. They are more often associated with larger enterprises and advanced technical expertise.
These niche features are much different from the capabilities offered by Excel, making it possible to build complex models for forecasting and reporting. Advanced analytics tools can handle complex queries, identify patterns, and provide better insights by looking at multiple pieces of data from different viewpoints. They also work much more quickly than the simpler tools.
Here's an overview of how some of the more advanced BI features work:
Predictive analytics | Enables users to predict customer behavior, forecast demand, and prepare strategies using modeling, statistics, machine learning, and data mining tools. |
OLAP | Helps users view a data slice from different viewpoints and improves reporting capabilities. |
Trend indicators | Help users spot patterns in production, sales, and distribution lines and identifies anomalies. |
Strategic planning tools | Allow users to create high-level financial and operational plans based on past performances and future goals. |
Unlike the more common features, which all members across teams can use on a daily basis, niche features are generally used only by select teams or individuals.
For example, strategic planning will find better resonance with higher level management teams, while OLAP requires some knowledge of programming languages.
Vendors may also charge extra for add-ons such as predictive analytics and OLAP support.
But with the explosive growth of data volumes, aggressive competition in the market for customer acquisition and retention, and growing availability of a variety of BI tools, some smaller businesses have started using advanced analytics functions.
Here are examples of a few advanced analytics features and how small and midsize organizations benefited from them:
Predictive analytics. Scrum, Inc., a corporate training company, was facing challenges managing its siloed data; management was finding it difficult to track operations, marketing, and finance metrics in one place using the existing analytics systems.
Domo BI helped Scrum, Inc. set up a predictive model to monitor how quickly their courses were filling up. This enables management to decide whether a greater investment in marketing may be required, by predicting whether they are on target to fill the classes.
OLAP. A government collections agency in the U.S. used Microsoft SQL Server's OLAP technology to improve its performance reporting. The collections agency provided regular performance reports (called CARE reports) to its clients. The CARE reports were bulky, inflexible, and did not allow users to filter data or do any further analysis on it.
Using Microsoft SQL Server, the firm converted its old CARE reports into an OLAP cube. Using the OLAP cube, the agency developed a flexible performance report for clients and saved $200k in accounting software expenses. The OLAP reports also helped the firm reduce the time to close its accounting books by five days.
Trend indicators. BGF Industries, a textile manufacturing firm, uses trend indicators to monitor their products and prevent potential errors. SAS Enterprise BI for Midsize Business helped BGF Industries create an early warning system to monitor data and production trends in real time.
The company needed to monitor between 4.5 and 5 million data points. Their existing systems took about 30 minutes to get the data. After incorporating SAS Enterprise BI into their production process, BGF took half the time to retrieve data. Bobby Hull, Corporate Quality Assurance Manager at BGF, acknowledges that the software has helped them “spot trends, improve quality in our products and better serve our customers."
Feature Checklist for products in Capterra's Top 20 Most Popular Report
So which products offer the features you need? Here are Capterra's top 20 BI software programs and the capabilities they offer presented in two BI features checklist.
The Advanced BI Features Checklist helps you find products with features that are not always found in more basic BI software. If you are looking for standard features in BI software, make sure you read the Basic BI Features Checklist below, before purchasing.
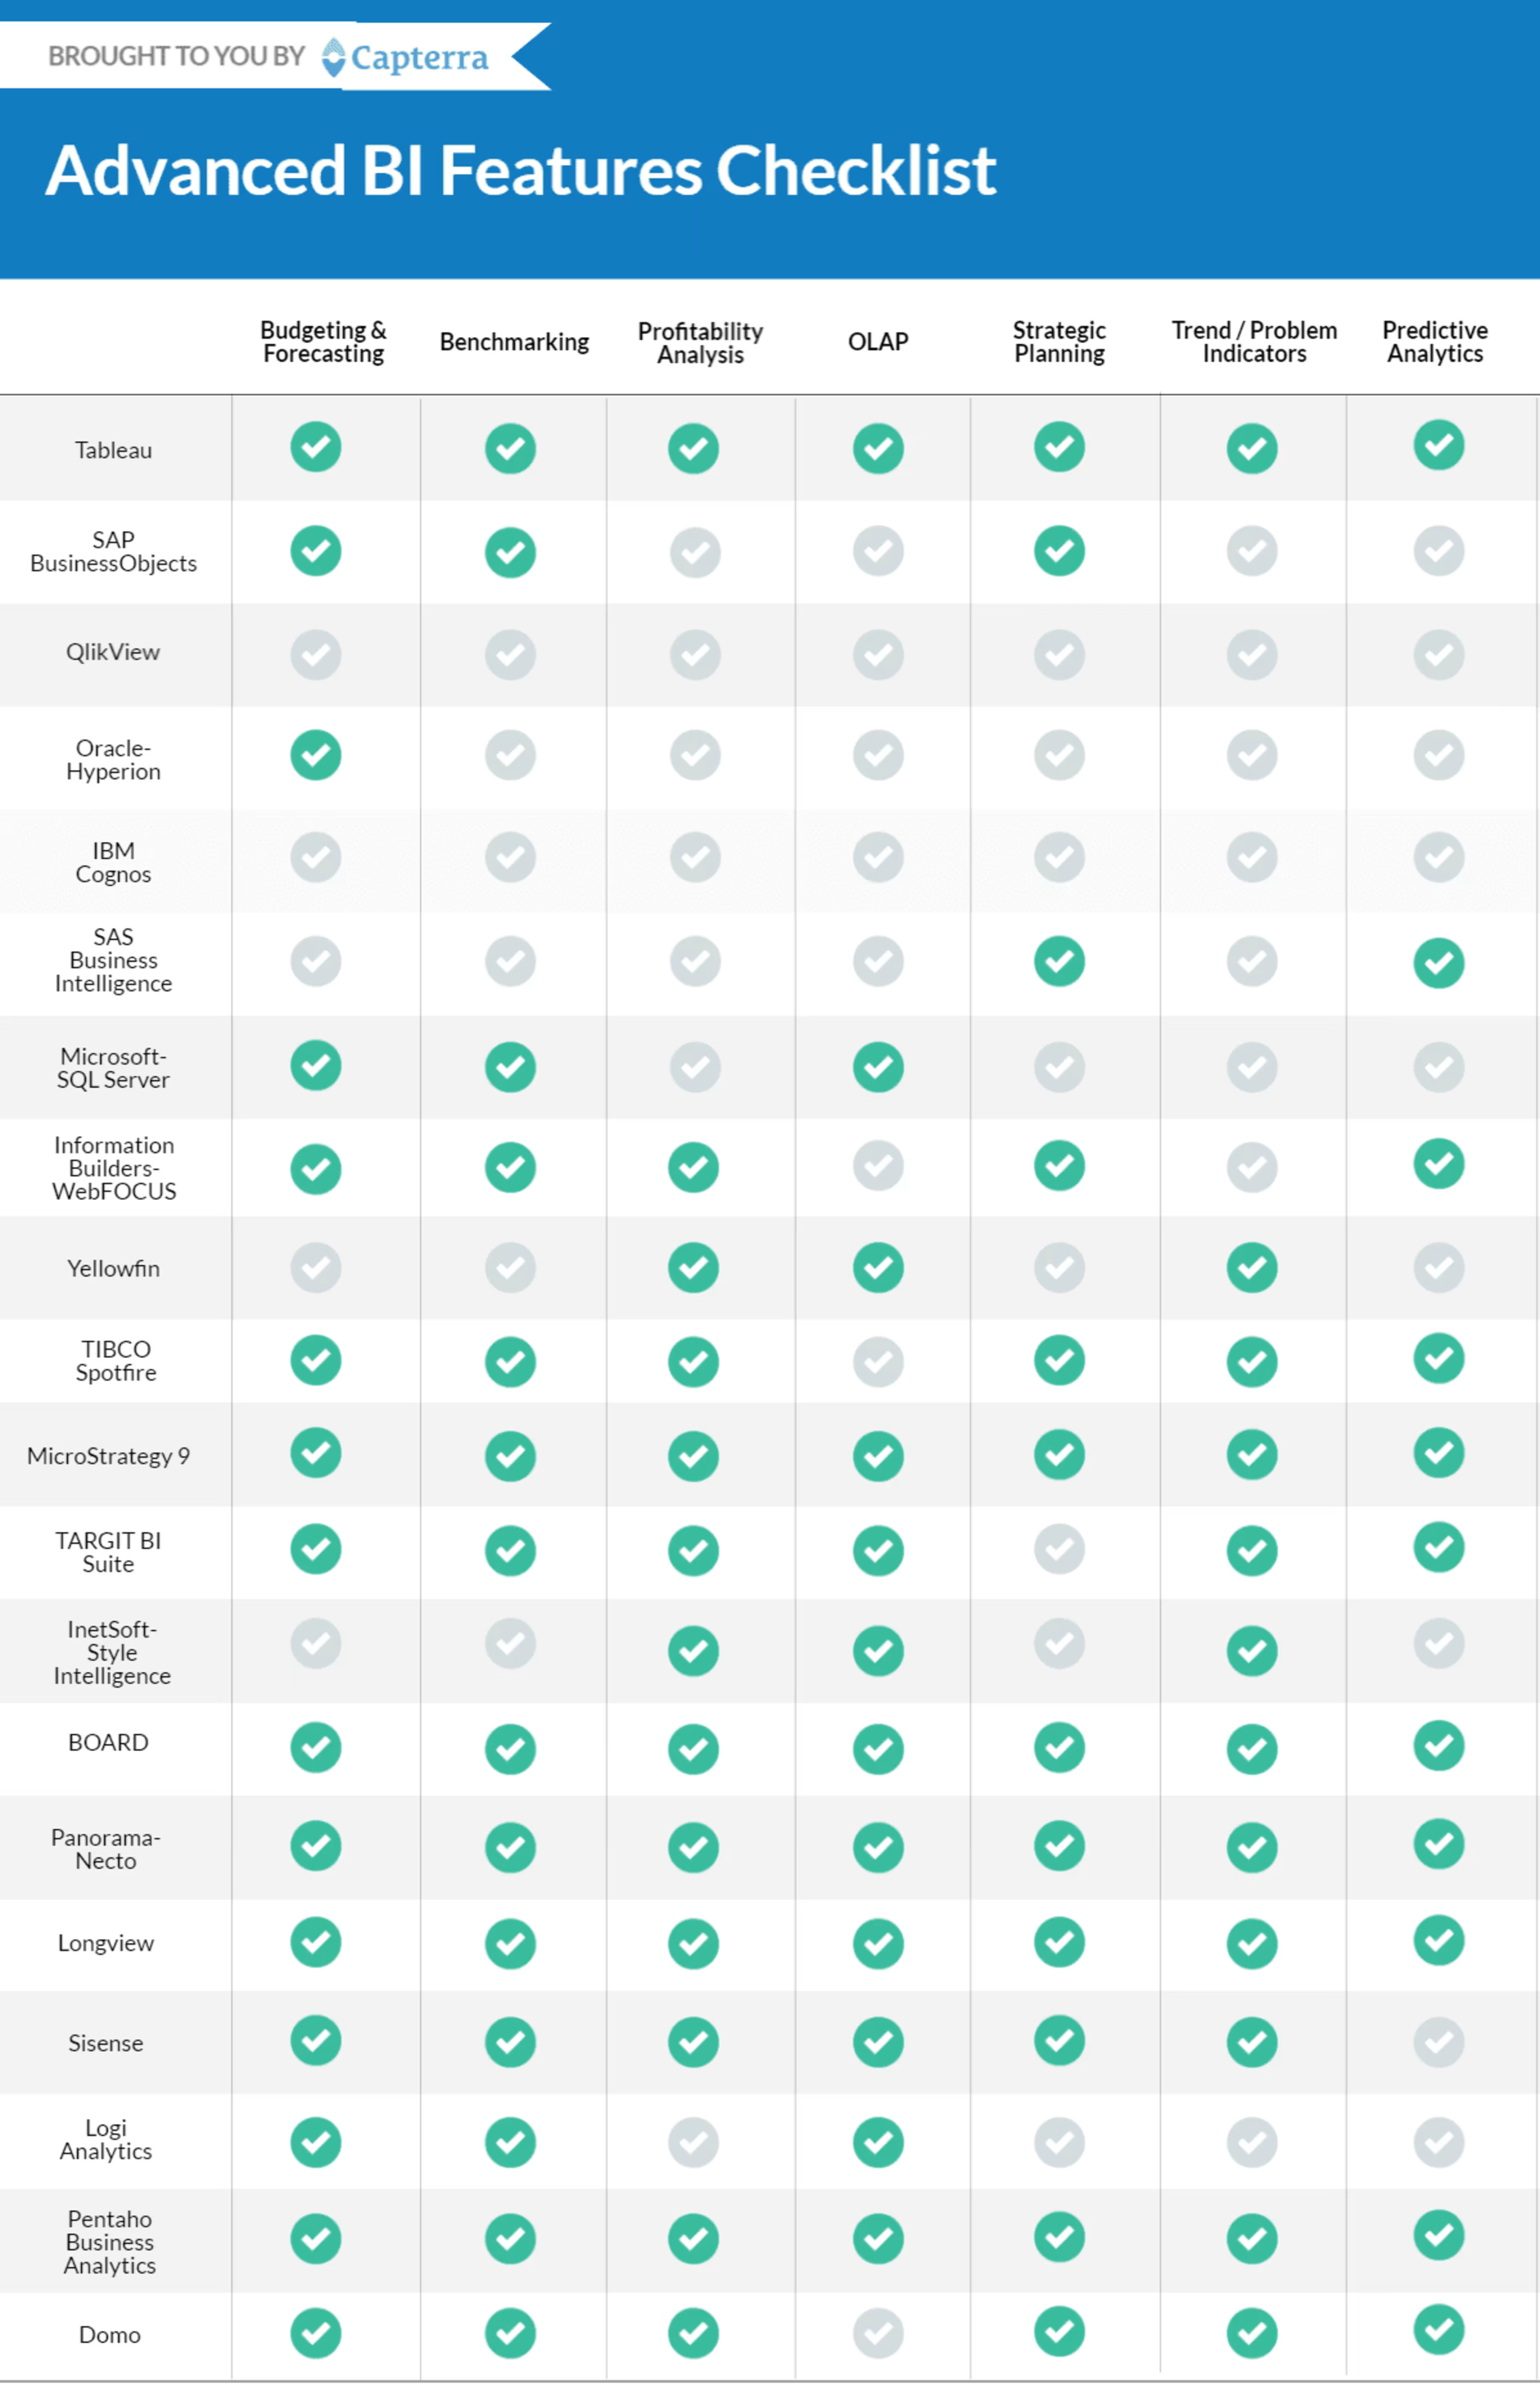
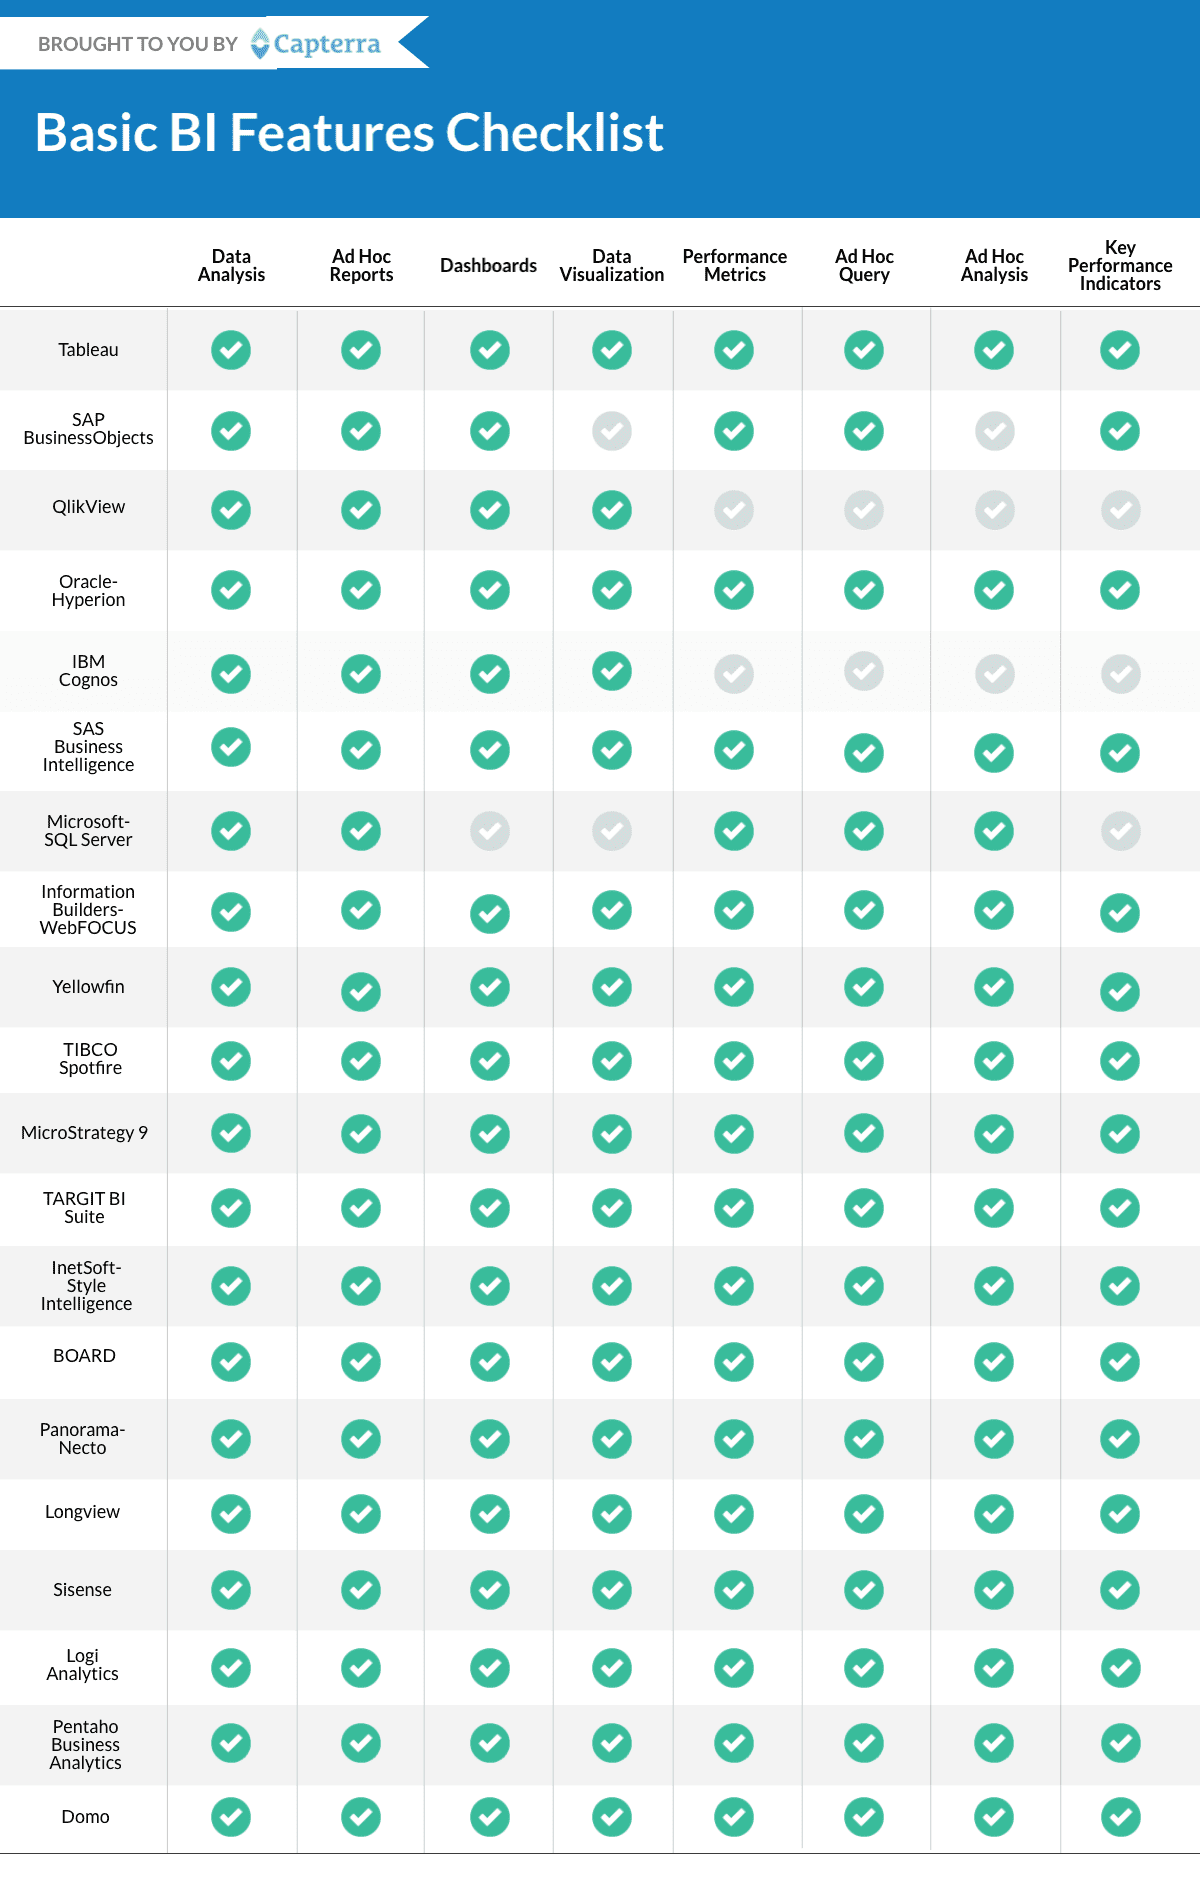
Note: Based on Capterra's feature checklist and secondary research
Next Steps
Do you think that the more common BI features will be enough to meet your requirements? Or will you require one or more of the advanced options along with the common features?
Visit Capterra's directory on BI products to learn even more about different BI software products. You can filter the options based on features offered, number of users supported, and deployment models.
Also, don't forget to tell us about your experiences using different BI software in the comments section below.