Make your data easier to understand by presenting it in a graph in Google Sheets.
The best way to make your data-heavy spreadsheets easy to understand is adding a graph. Graphs and charts in Google Sheets help present data in a straightforward, easy-to-process way, making decision-making more efficient.
For example, you can create line charts to visualize sales data over time by comparing sales figures across products and regions. This allows you to identify trends and make decisions and sales targets, and inventory management.
What are charts in Google Sheets?
Charts or graphs in Google Sheets are visualizations of the data you’ve selected on the sheet. Google Sheets refers to all kinds of graphs as charts.
How to choose a chart type for your data
Google Sheets allows you to use a variety of chart types. To choose the right kind of chart, you need to know what you’re trying to do with your data and what each type of chart does.
The different chart types (and their uses) include:
Line charts: Visualize trends over time.
Combo charts: Illustrate each data series as a different marker type (e.g., column or line).
Area charts: Track multiple data series graphically.
Column charts: Separate data into groups or subcategories.
Bar charts: Show differences between data points.
Pie charts: Illustrate data as proportions of a whole.
Scatter charts: Find trends and patterns between variables.
Histogram charts: Show data distribution across buckets.
Candlestick charts: Show values overlaid on variance.
Organizational charts: Show relationships between data points.
Tree map charts: Illustrate data as parent-child hierarchies.
Geo charts: Show location values on a map.
Waterfall charts: Show how values interact with a starting value.
Radar charts: Look at variables two-dimensionally.
Gauge charts: Compare and contrast measurements.
Annotated timeline charts: Show data as an interactive time series.
Table charts: Sort and page data.
How to create a graph in Google Sheets
Building a graph in Google Sheets is a multi-step process that involves selecting the data for your graph, choosing a type of chart to use, and setting up and customizing your graph.
How to select data for your graph
To enter and select data for your graph, follow these steps:
1. In column A, enter the data you want to use for the Y-axis (the vertical axis).

Source: All screenshots are from the author
2. In column B, enter the data you want to use for the X-axis (the horizontal axis).
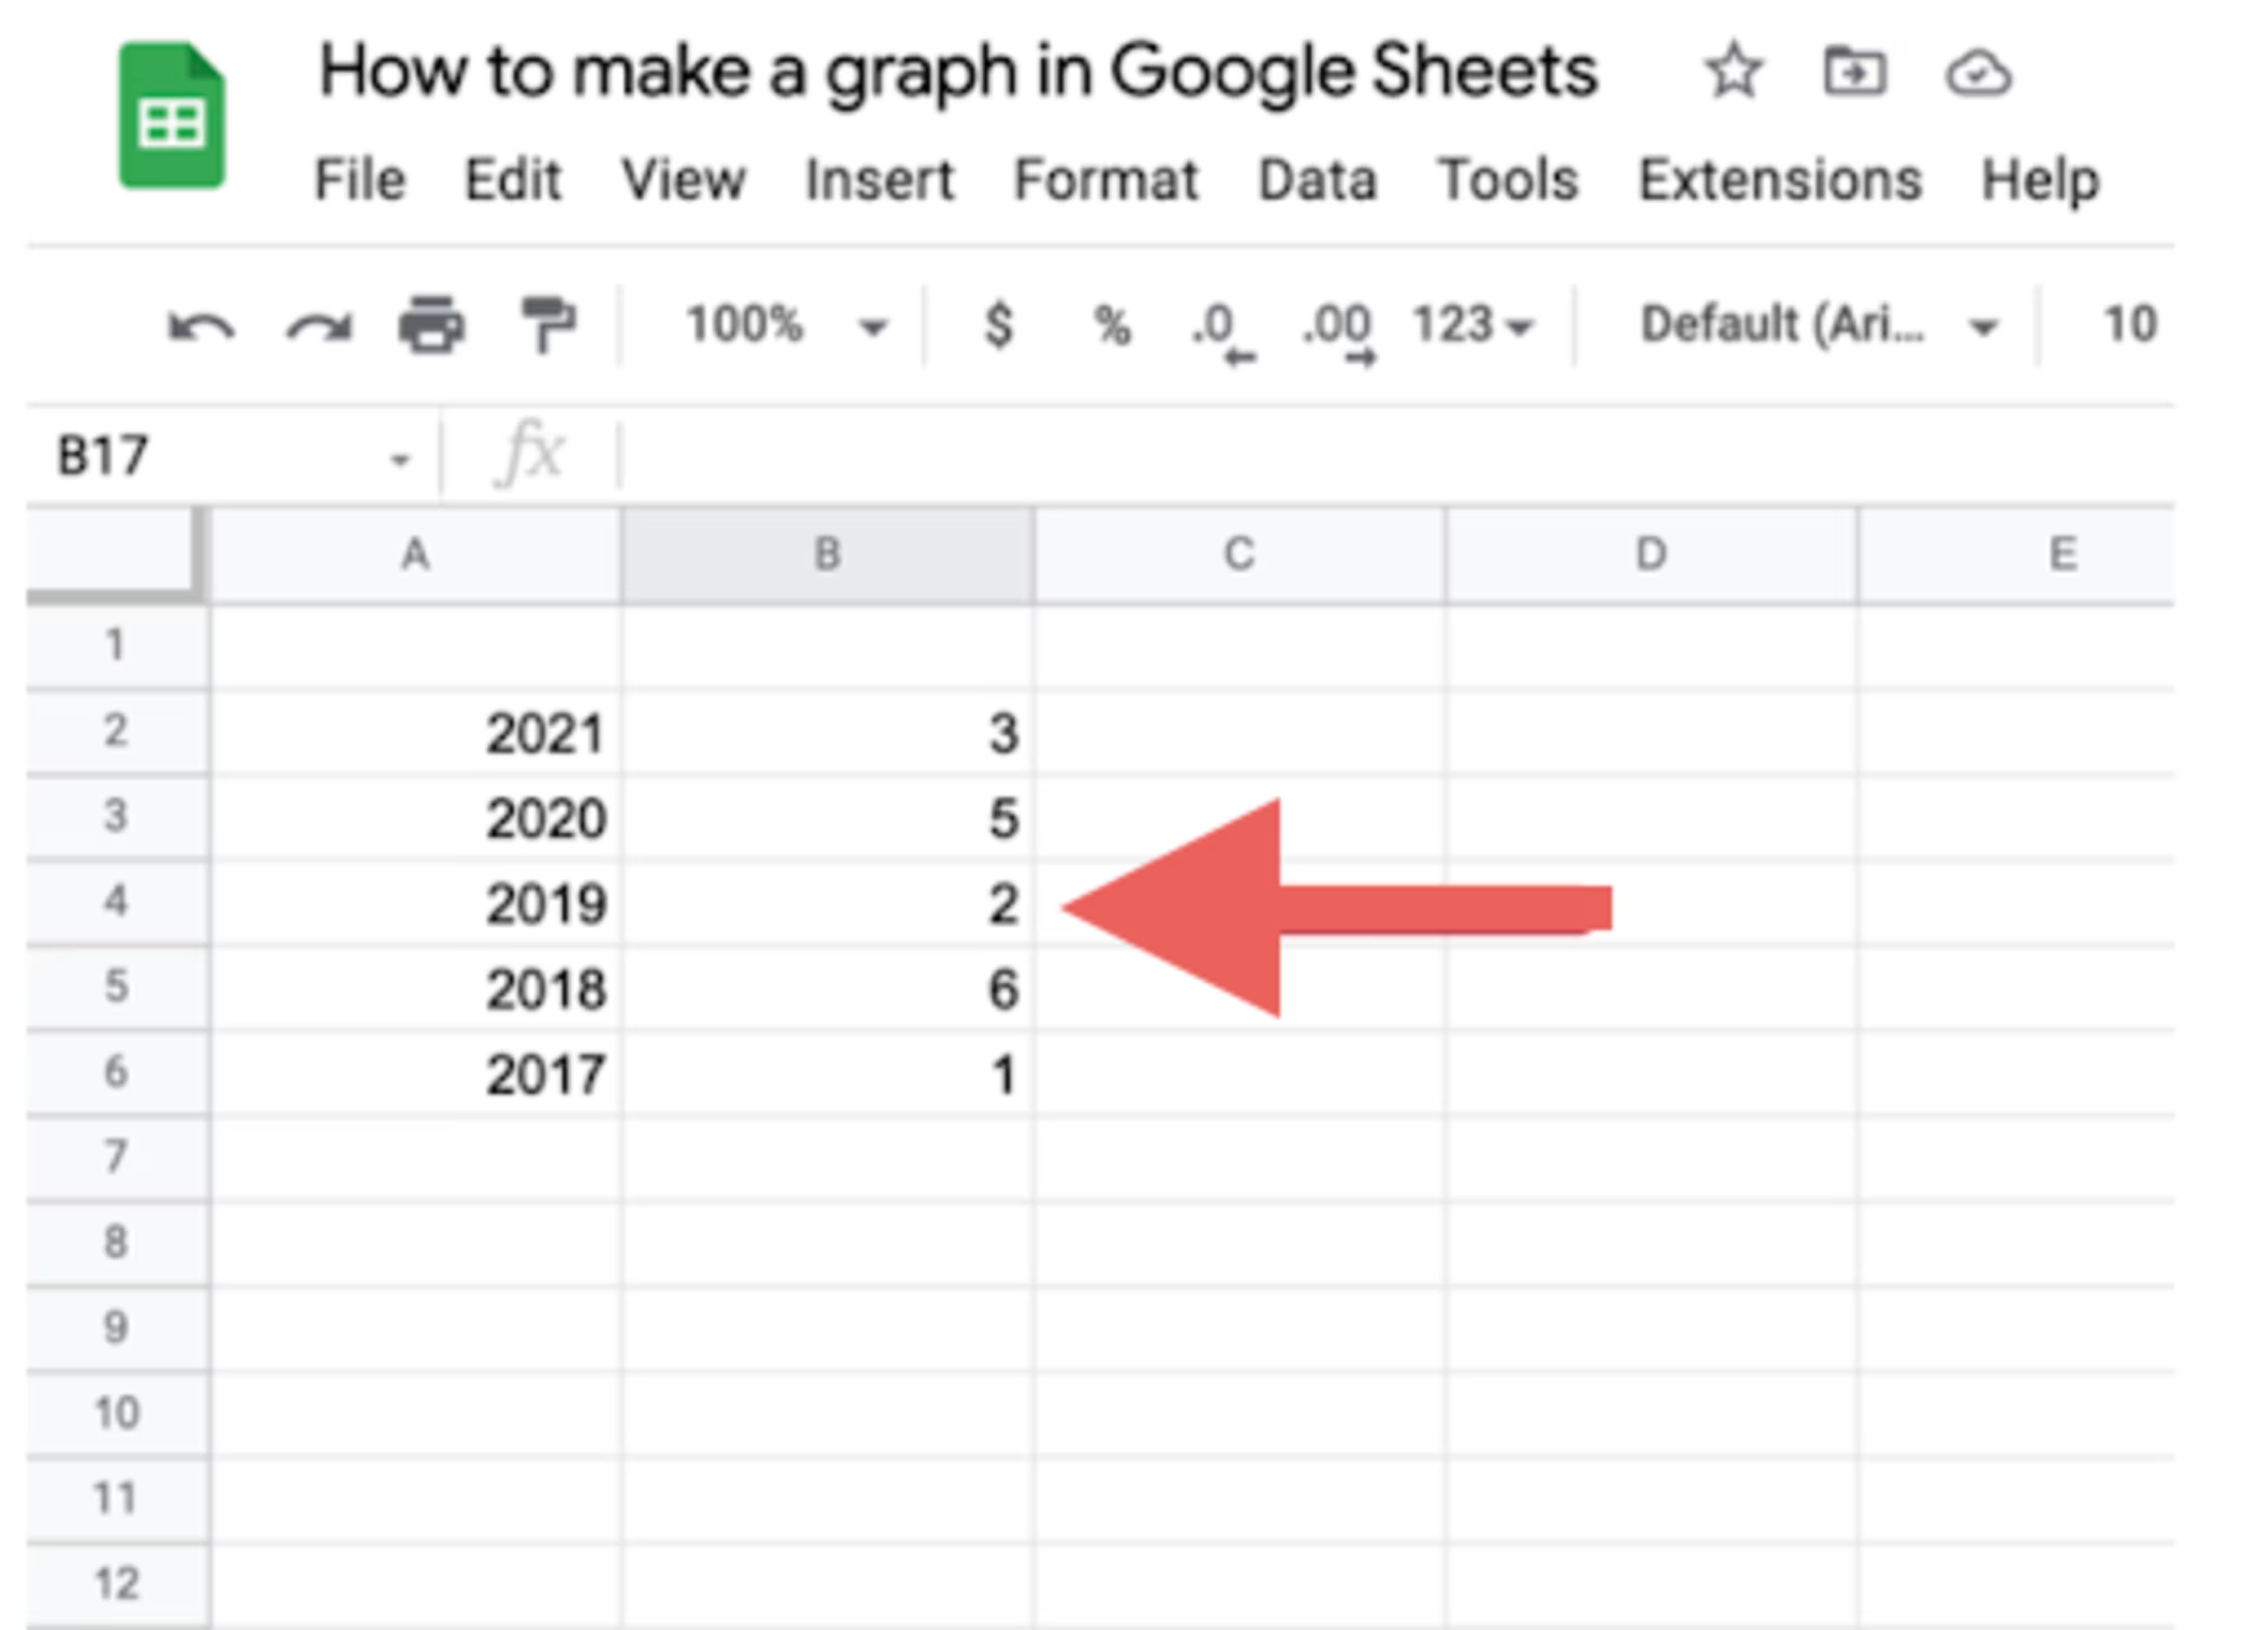
3. Bulk-select the data you want to include in the graph by holding the shift button to select the range, or using your cursor.
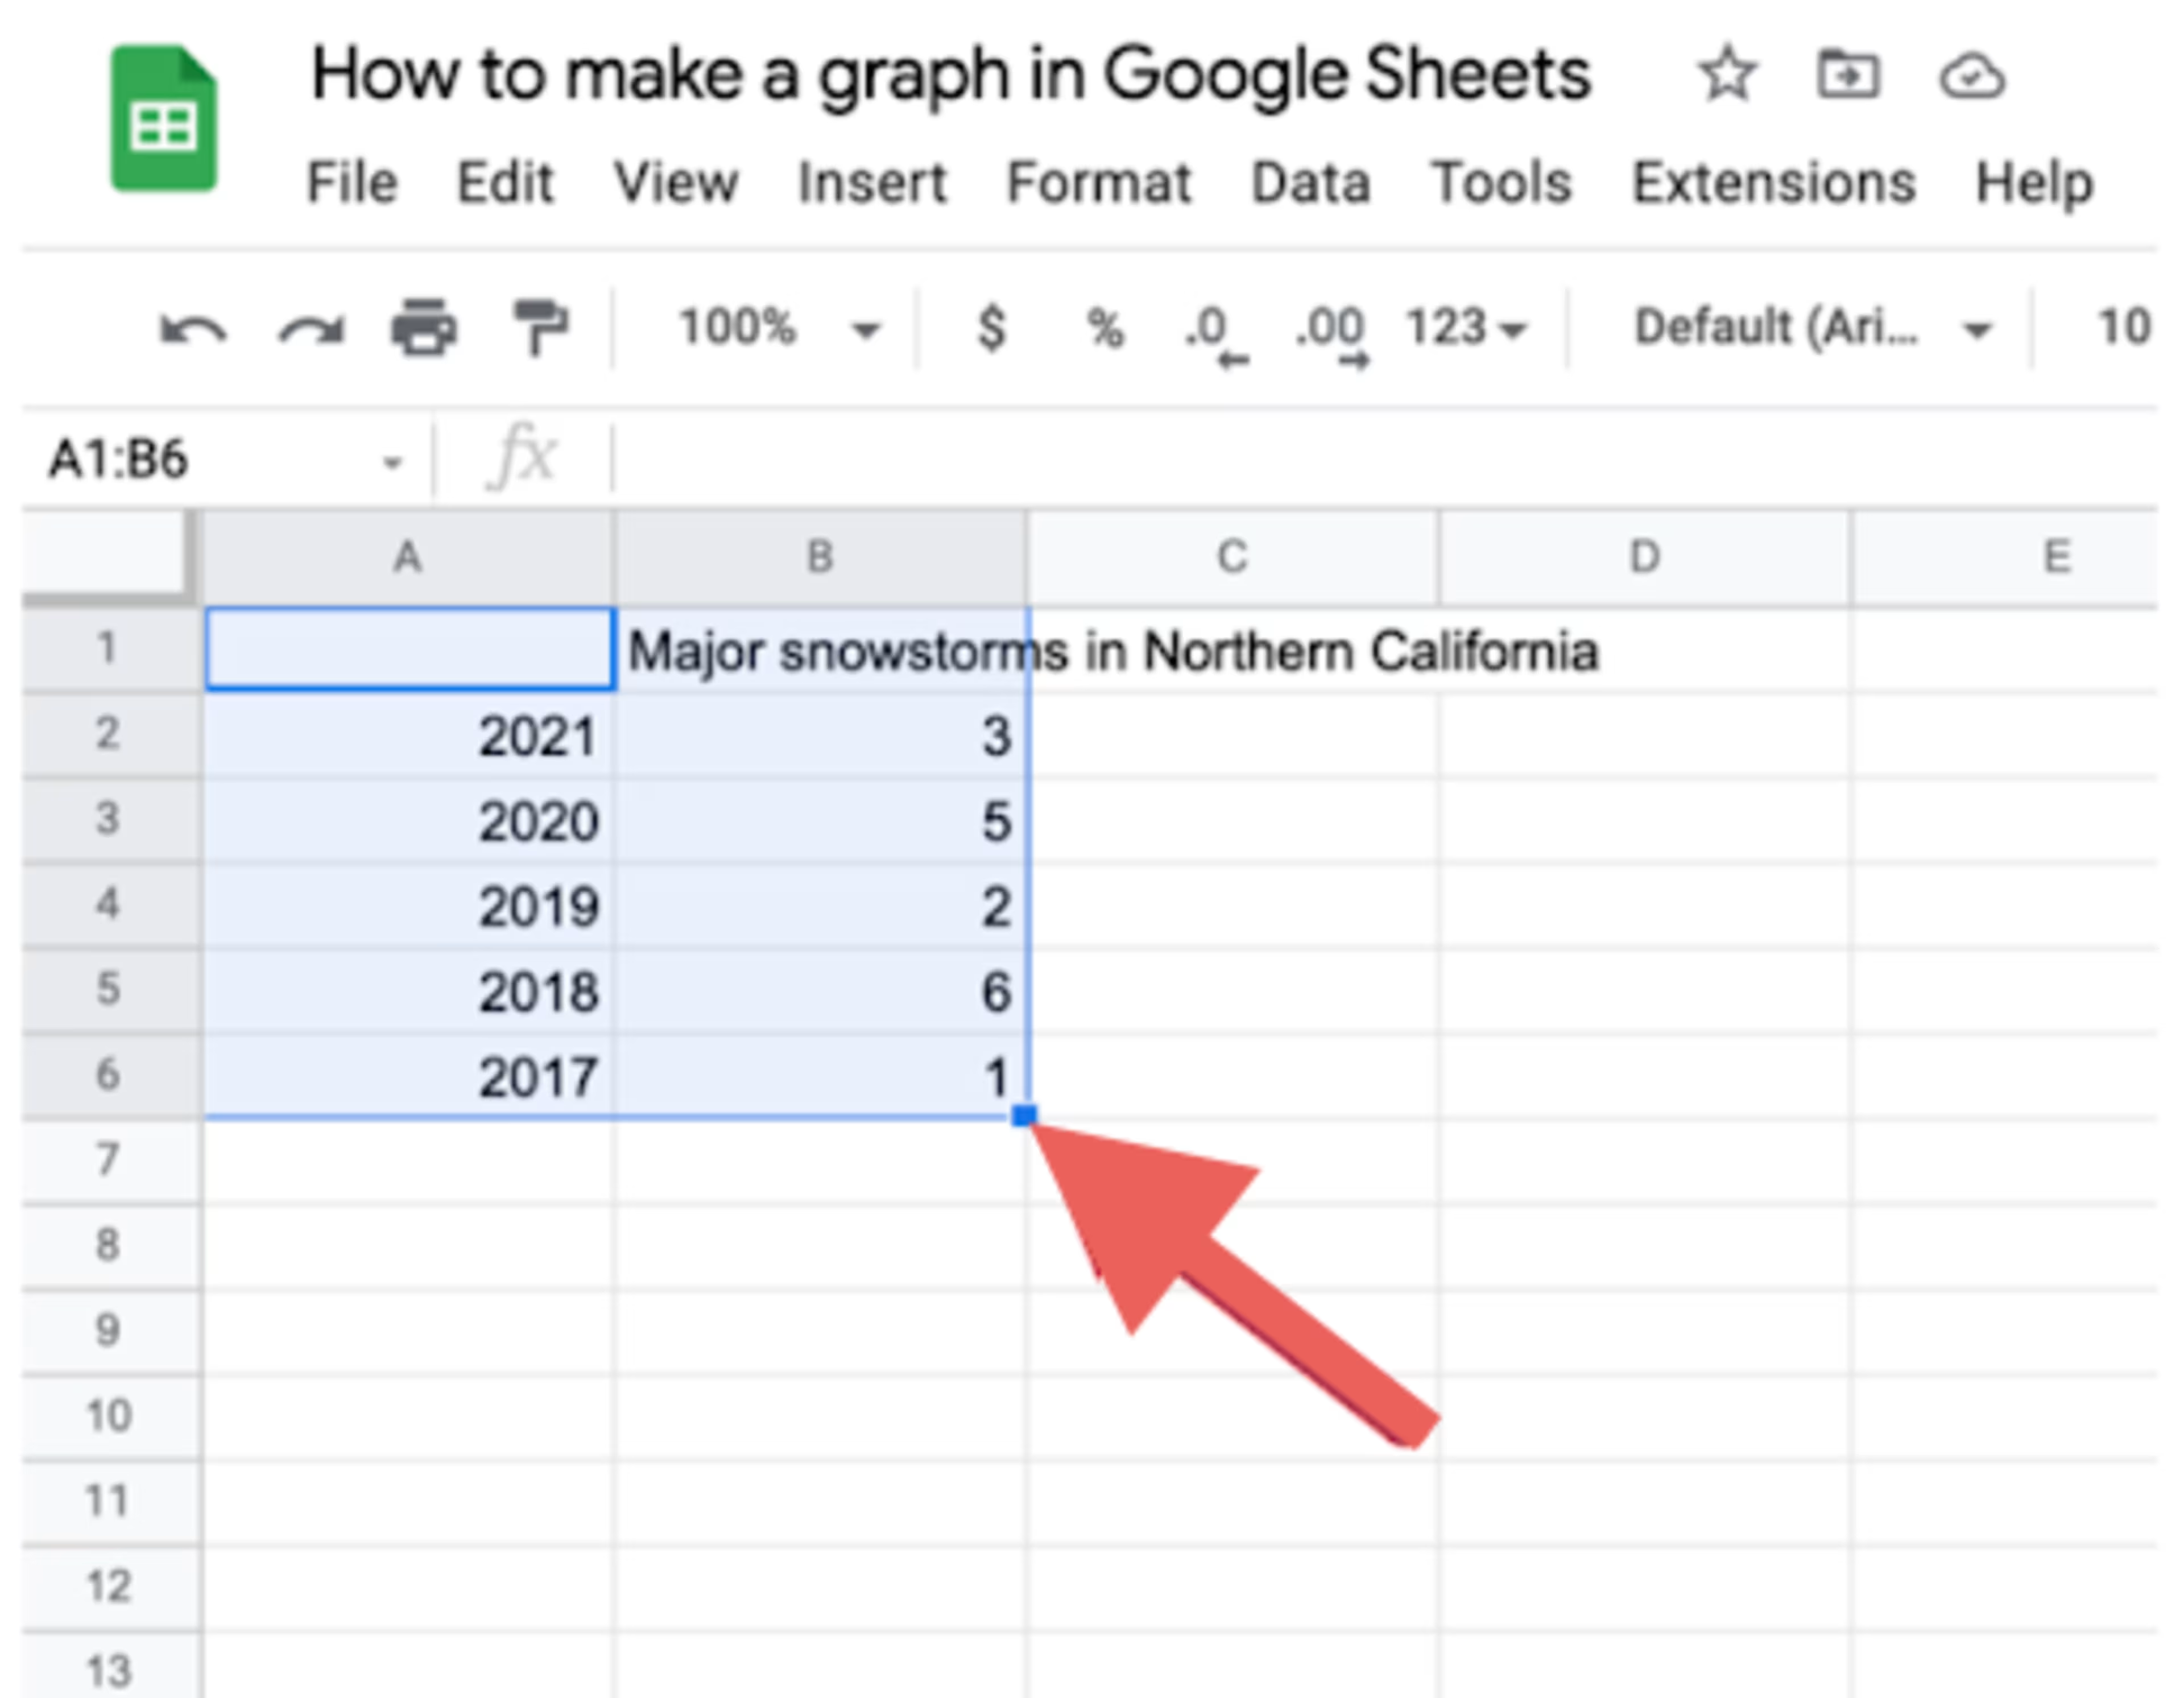
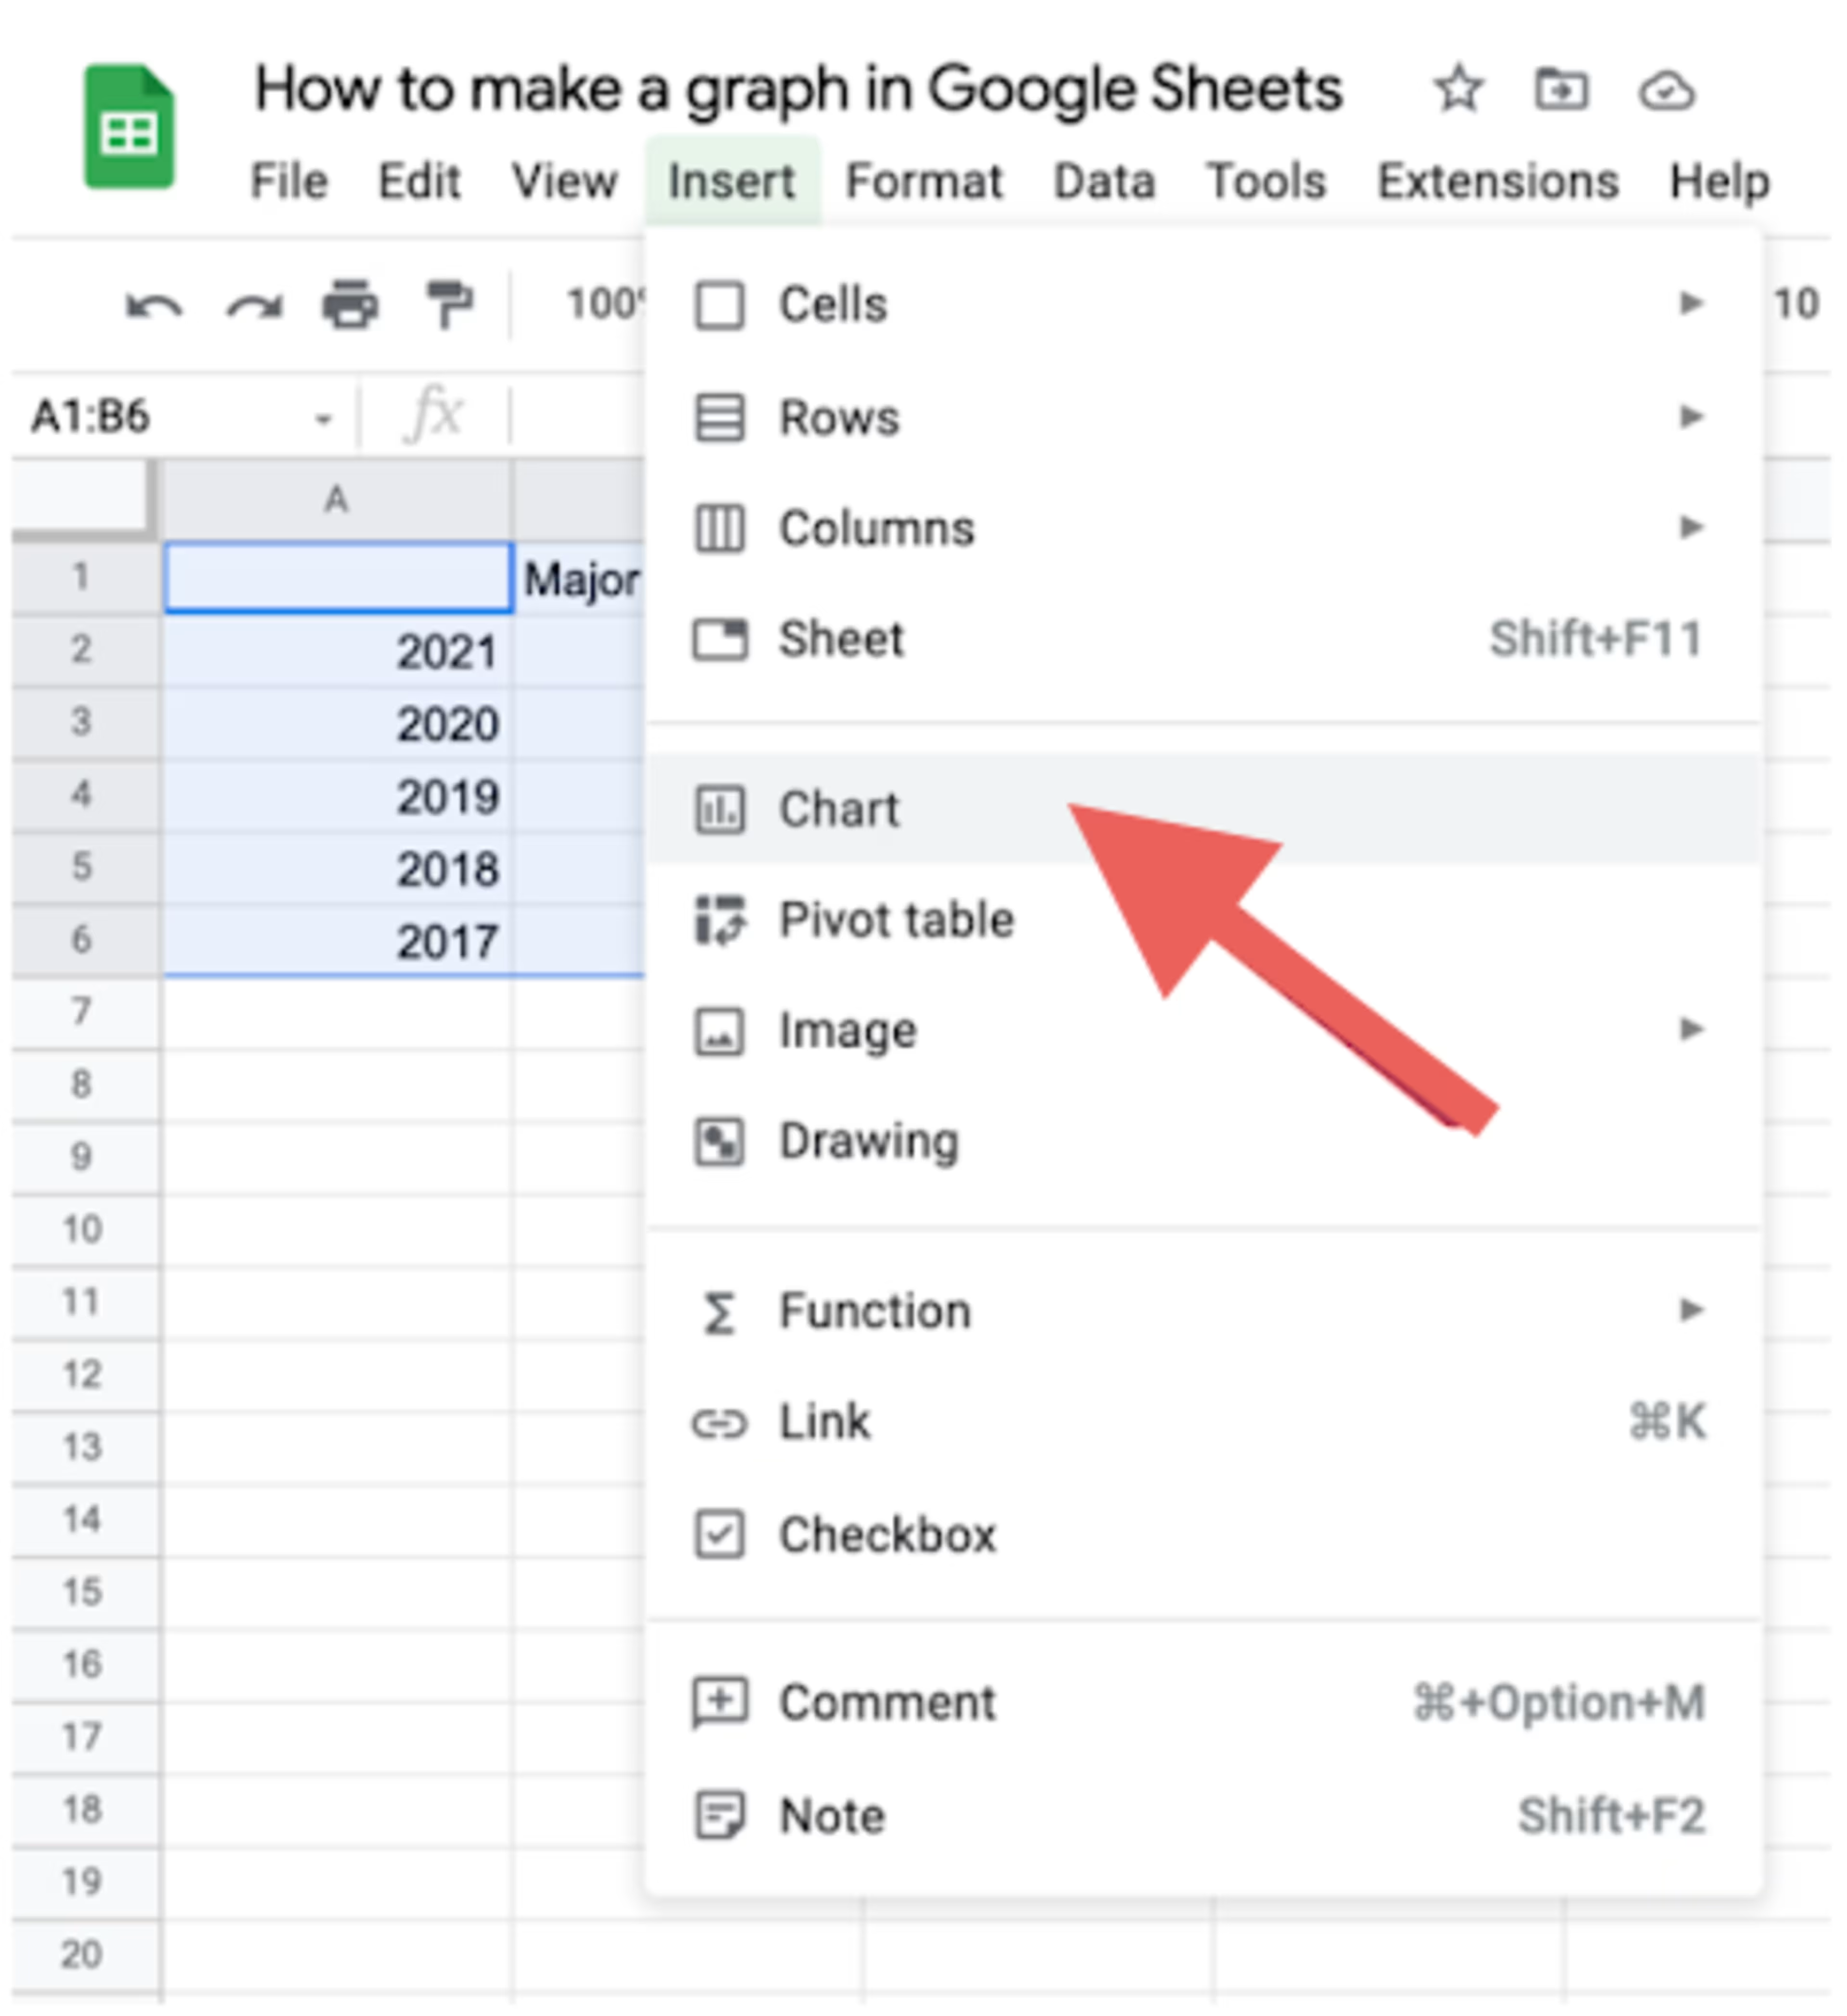
4. Click the Insert button and select Chart from the dropdown menu.
How to customize your Google Sheets graph
You can customize the appearance of your graph by using the Chart editor menu that automatically appears to the right of the chart when you generate it.
1. From the “Chart Editor” menu, select the type of chart you want to use. From here, you can also customize the data range, X-axis, series, and more.
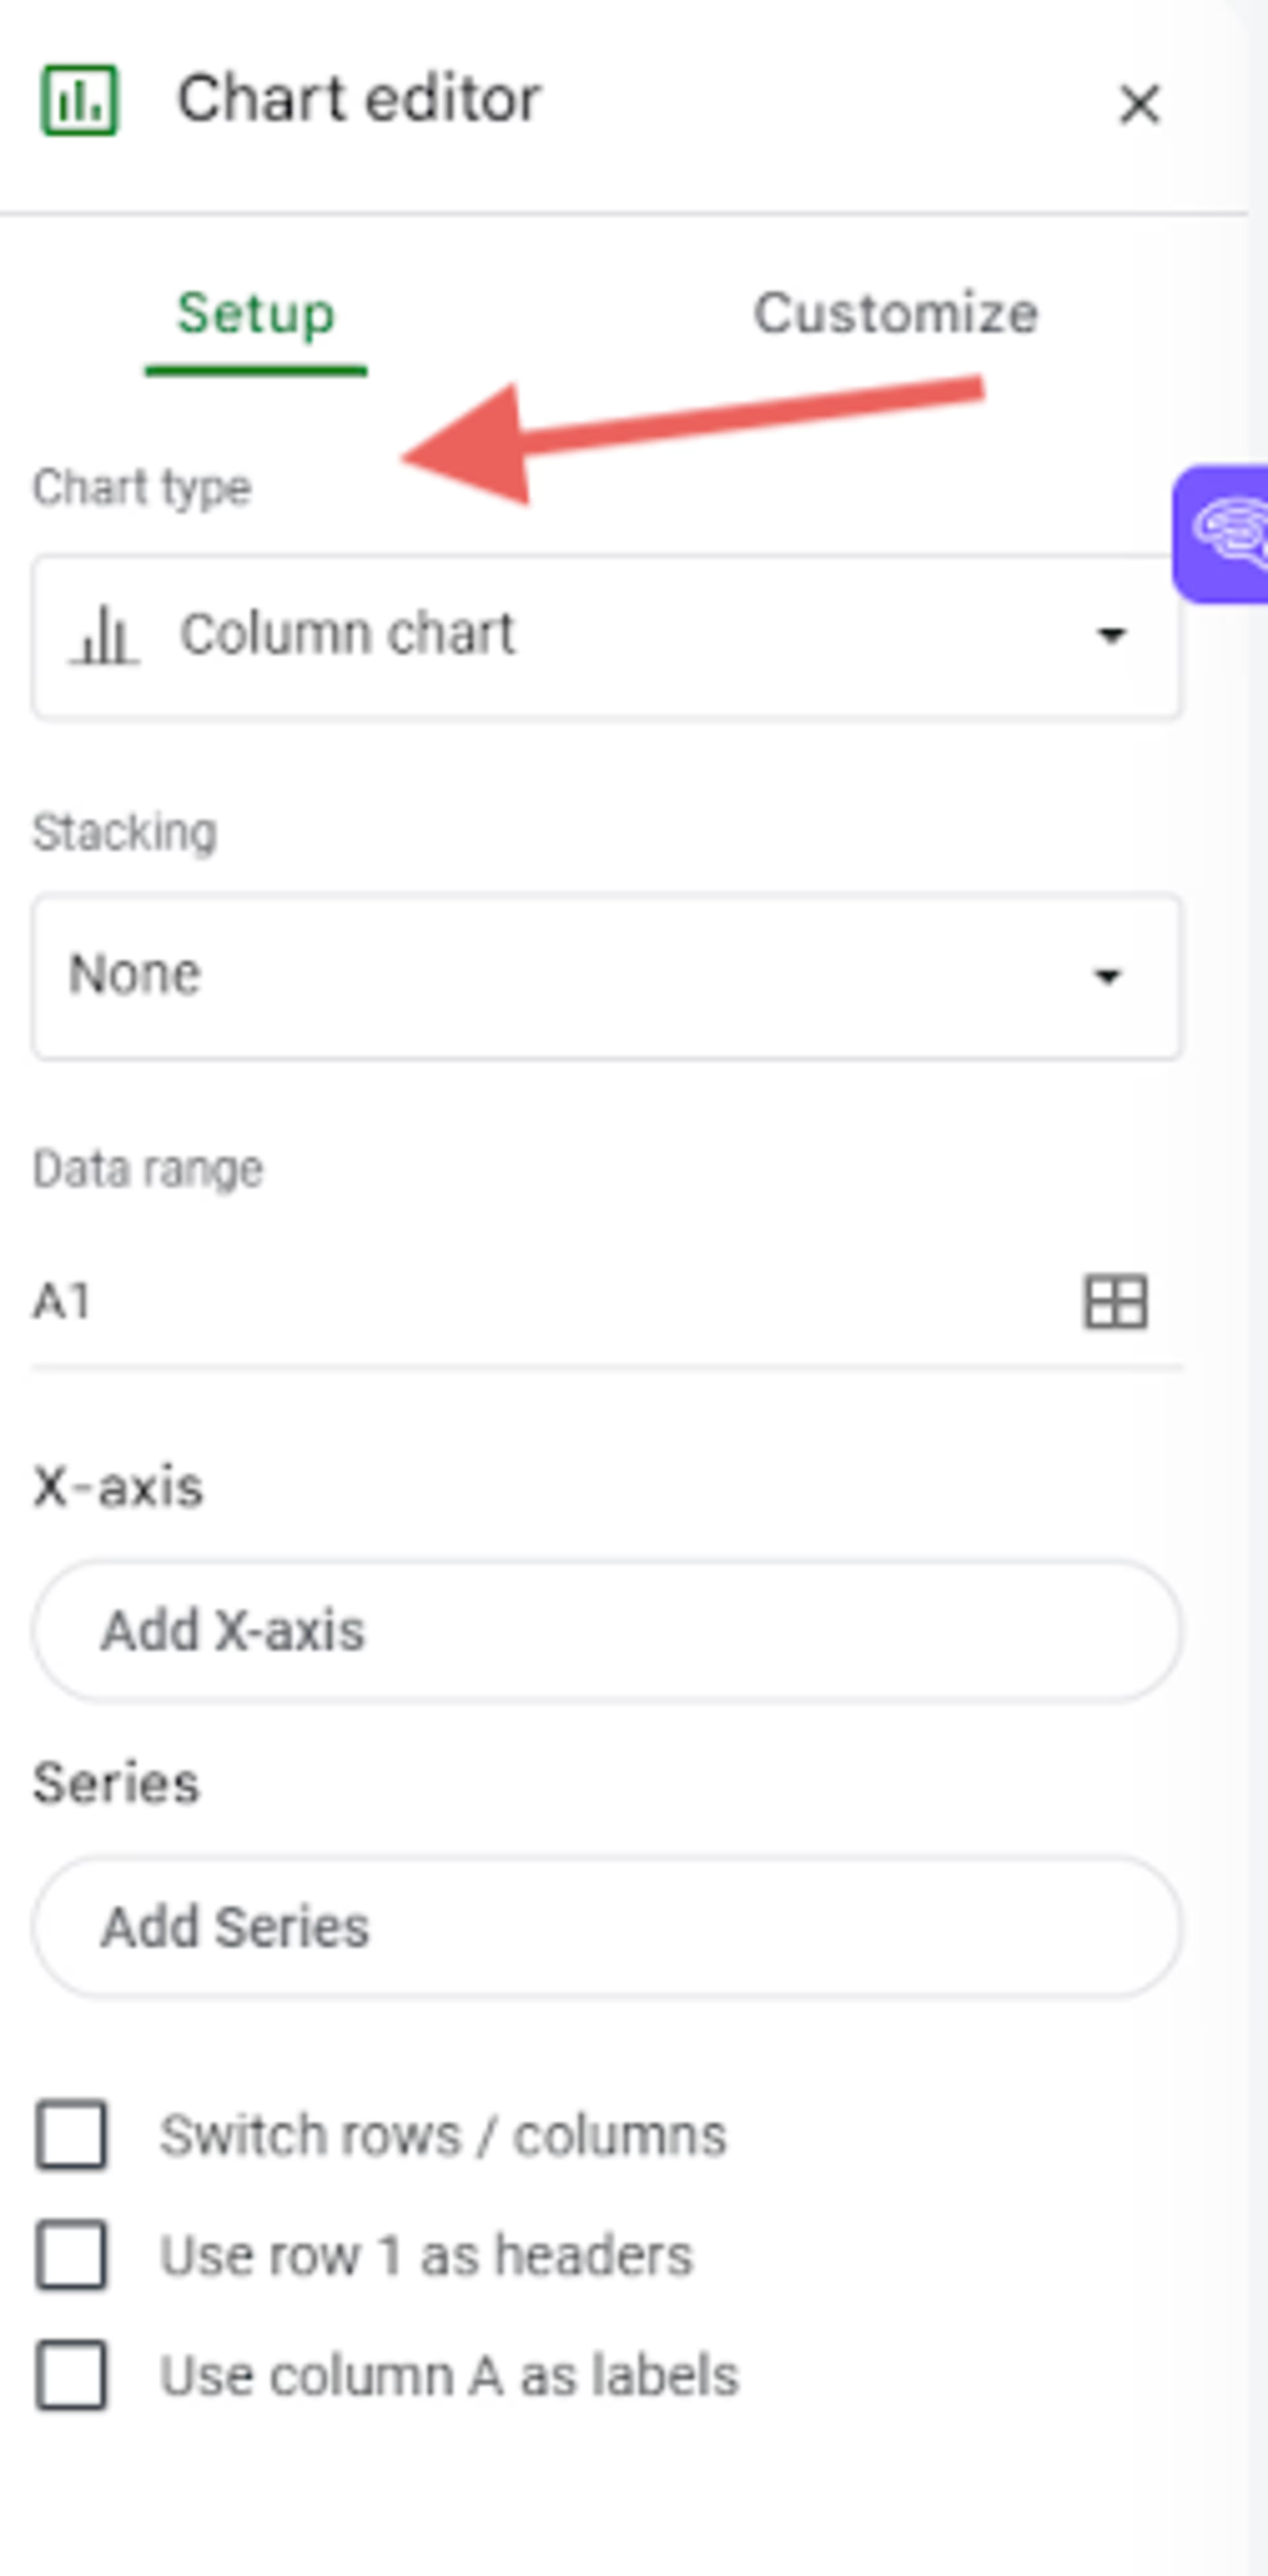
2. Select the Customize tab from the Chart editor menu.
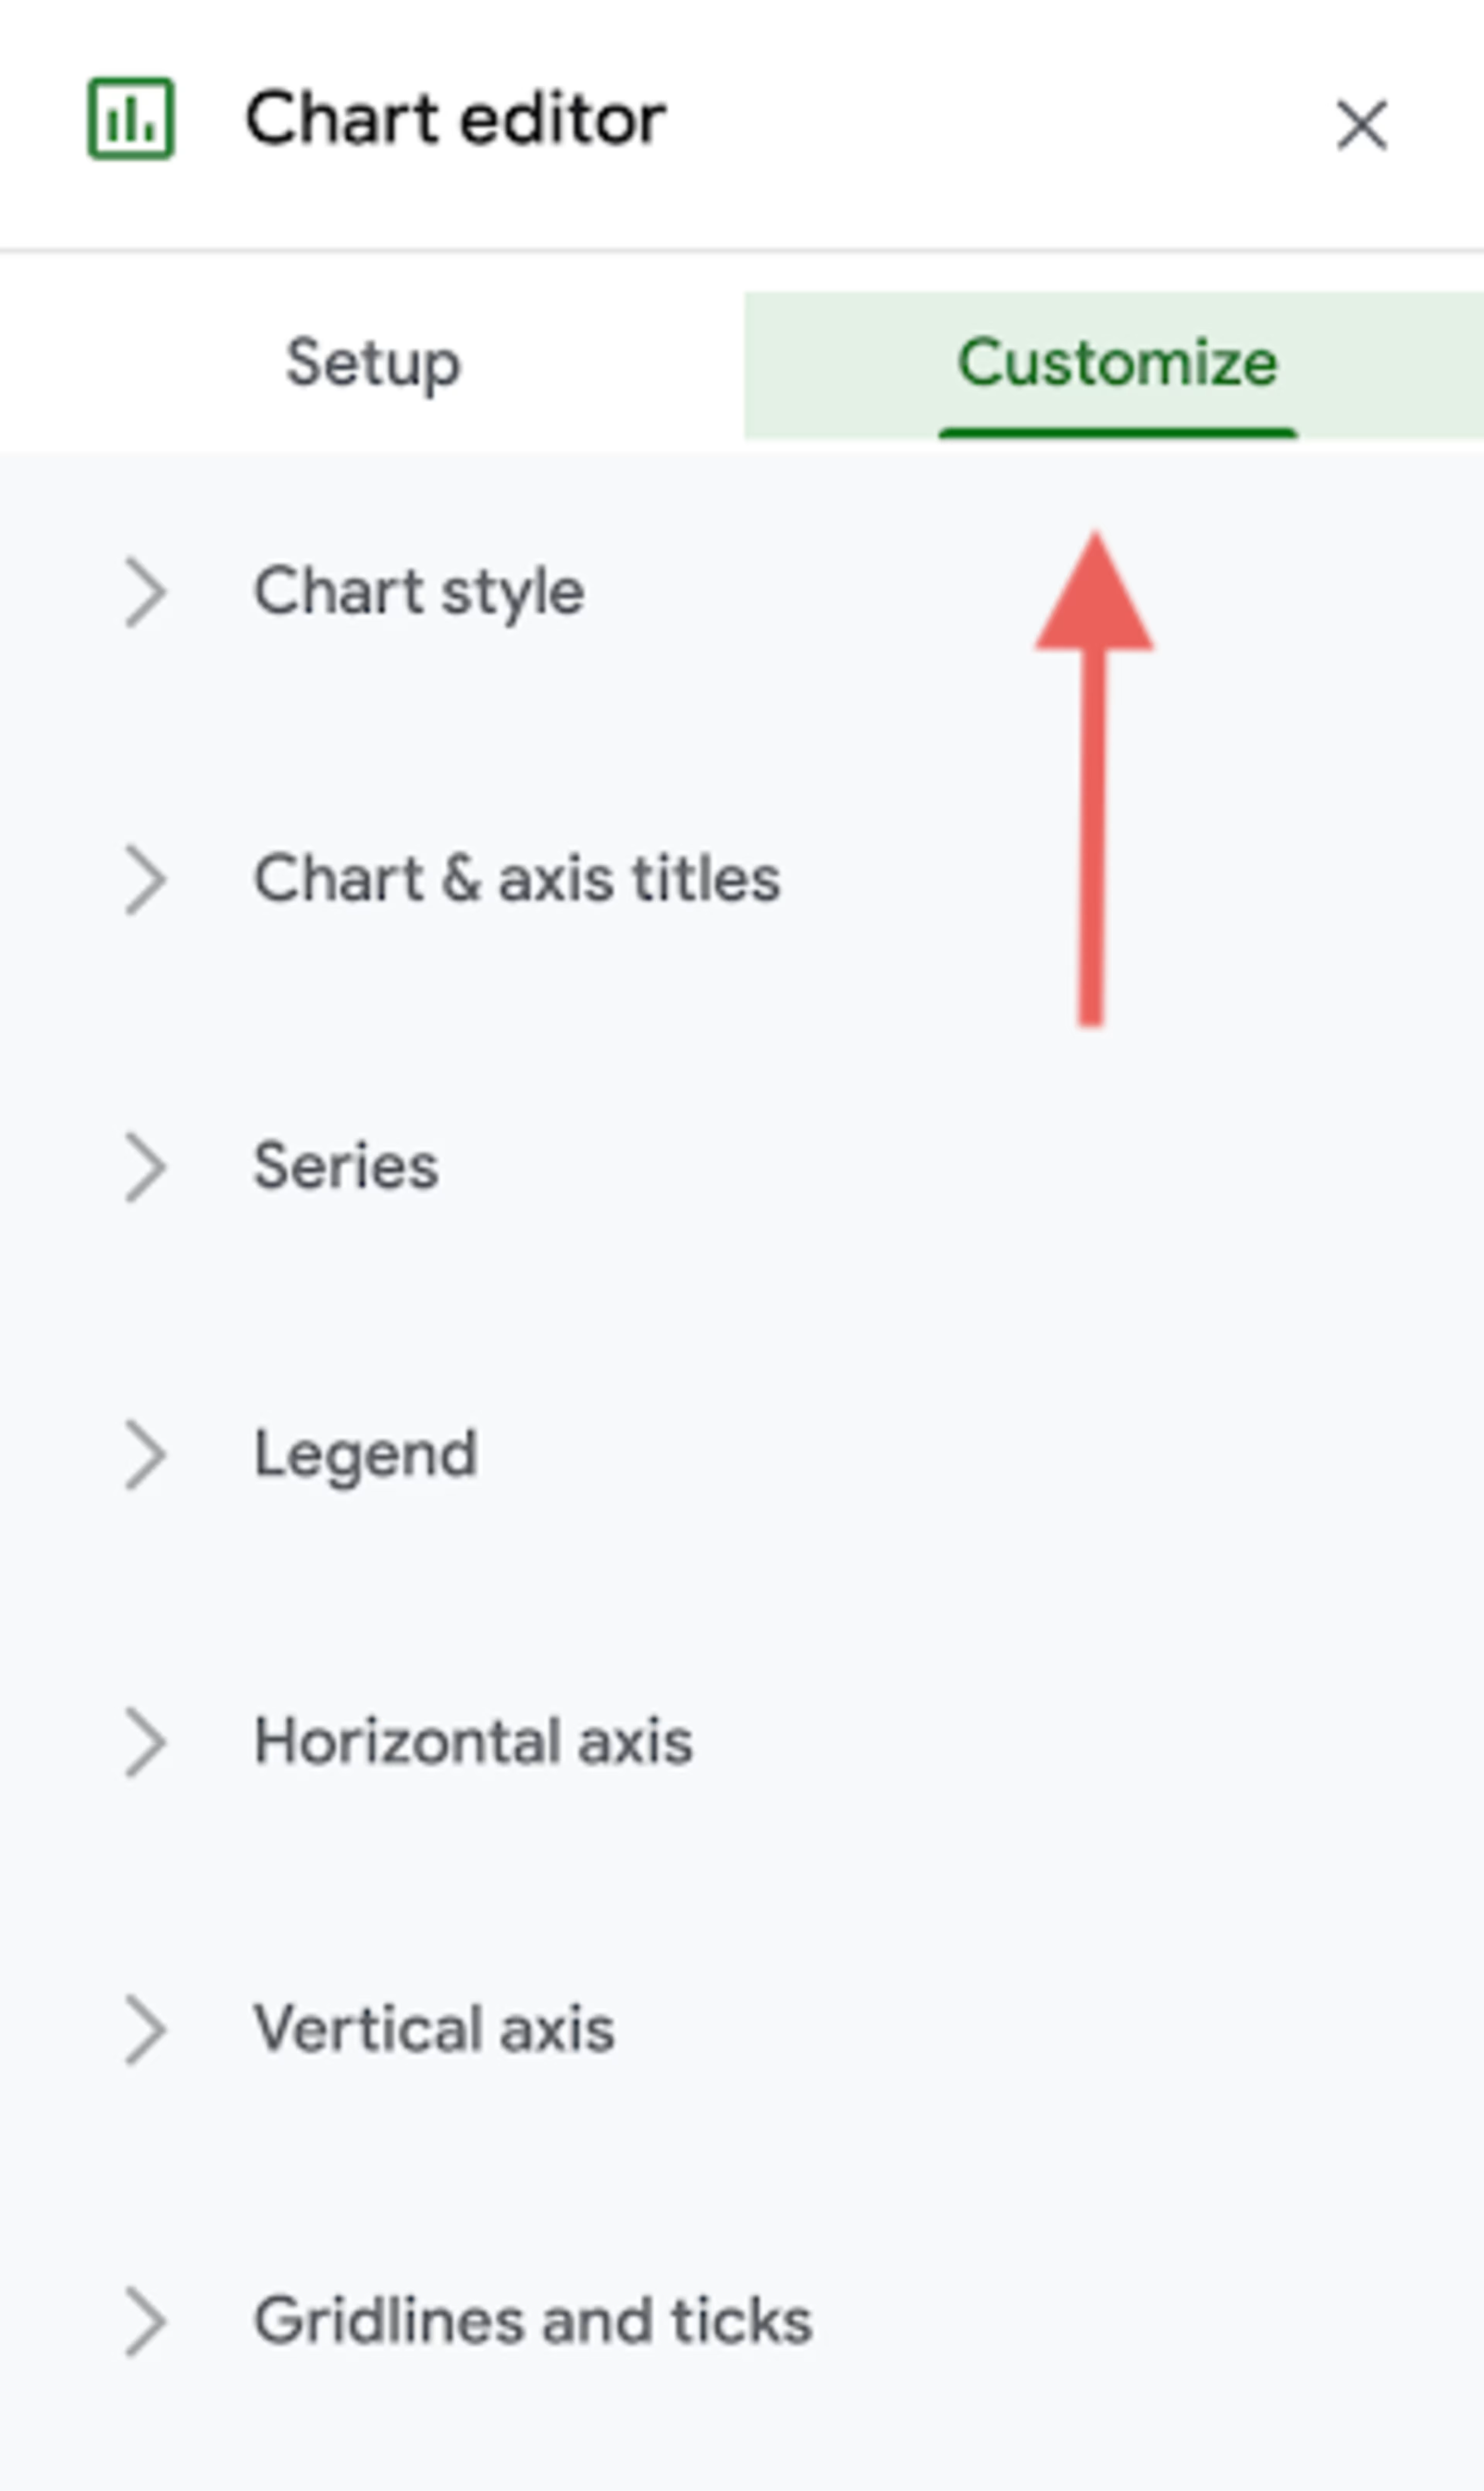
3. Select the customization option you want to use. The options include:
Chart style
Chart & axis titles
Series
Legend
Horizontal axis
Vertical axis
Gridlines and ticks
4. Once you select the aspect of the chart you want to edit, play around with customizing the fonts, sizes, colors, and weights to personalize the look and feel of your graph.
Tips for creating effective graphs
You can make your Google Sheets graphs more effective by using these best practices:
Use labels on your graph: Clear, descriptive labels on the X- and Y-axis make your graphs more informative, accessible, and user-friendly.
Use a consistent color scheme: Choosing and sticking to a color scheme helps enhance visual clarity and makes it easier to distinguish between data sets.
Choose the right chart type for your data: Selecting the right chart type ensures that your data is accurately represented and intuitive to understand. For instance, a column chart is ideal for showing comparisons and trends, while a line chart is ideal for connecting data points to visualize change between data points.
Make the most out of your Google Sheets use
Knowing how to create a graph in Google Sheets enables your team to collaborate and make the best decisions using smart data representations.
Get more out of your Google Sheets usage by checking out these additional how-to guides:

