Don’t waste your time on KPIs that fail to provide actionable insights.
As a new customer service manager, you likely want to know which customer retention metrics you should be tracking. But even the most widely used KPIs aren’t necessarily useful. Net promoter score, for instance, is measured by 76% of customer service leaders, according to Gartner[1], yet a third of those same leaders are skeptical of its impact on their service strategy.
Instead of wasting your time on KPIs that fail to provide actionable insights, focus on customer retention metrics that can help you form a clear plan to mitigate customer churn and boost loyalty. We’ve shortlisted four Gartner research-backed metrics to get you there.
What are customer retention metrics?
Customer retention metrics measure how likely your business is to keep its current customers and attract new ones. Customer service teams use these metrics to assess the performance of their business operations and inform their retention strategy.
1. Value enhancement score
Our first recommended customer retention metric helps measure customer loyalty and is what Gartner[2] calls the single best predictor of loyalty outcomes (e.g., retention, positive word-of-mouth, wallet shareHow to calculate value enhancement score
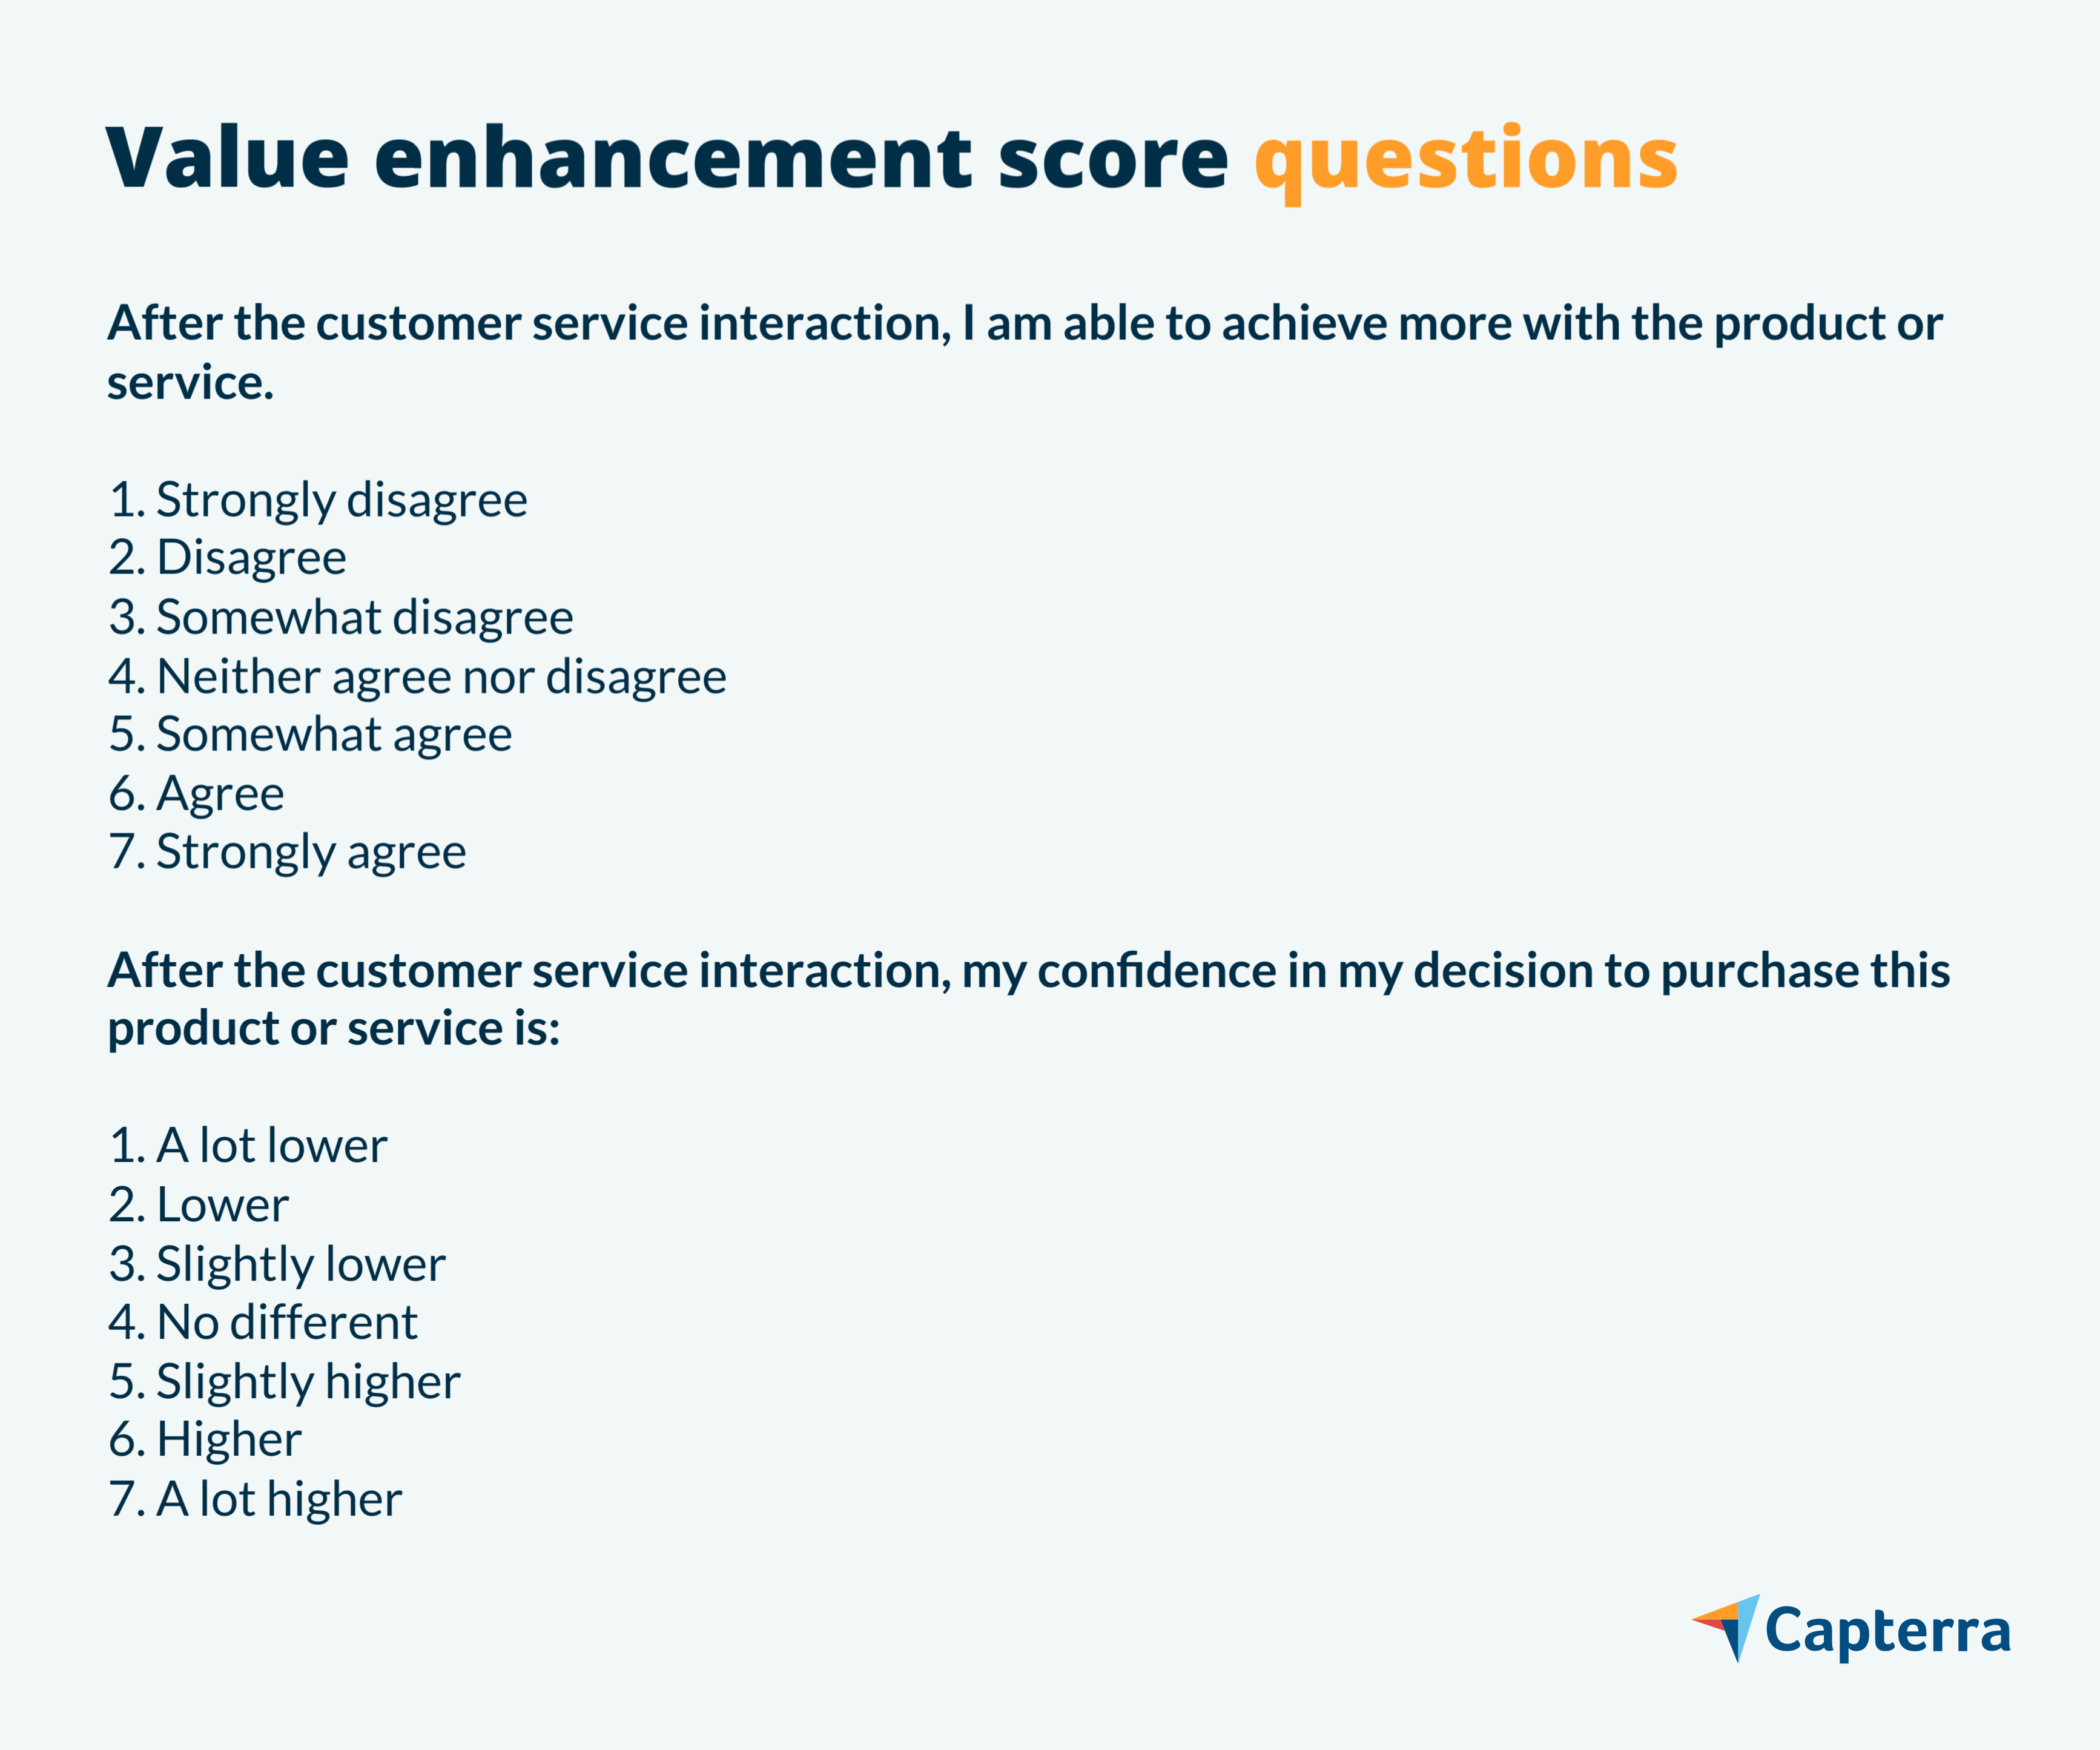
To measure VES, provide customers with a seven-point scale to assess their feelings toward the two statements in the image below. Then, take the average scores of the two statements.

These statements are important because they measure the change in a customer’s value perception after a service interaction. For example, a customer could have both entered and left an interaction feeling confident. However, by asking them to assess whether their confidence increased as a result of the interaction, you can better assess your team’s impact.
What a good value enhancement score looks like
Gartner research[2] suggests you won’t see any substantial changes in outcomes such as retention, positive word of mouth, and wallet share until your VES moves from a 5 (“somewhat agree” and “slightly higher”) to a 6 (“agree” and “higher”). As such, you’ll want to aim for a VES of at least 6 to achieve anticipated loyalty benefits.
/ Software tools to try
We recommend placing your VES statements in all post-transaction surveys, as soon as possible after a service interaction. For that, use survey software, which includes various user feedback formats such as check boxes, drop-down menus, and free-form text fields. It also provides many data reporting tools including bar graphs, line graphs, and cross-tab reports.
2. Customer satisfaction
Customer satisfaction (CSAT) provides feedback on a customer’s satisfaction with their service interaction. Unlike VES, CSAT focuses less on customer loyalty and more on providing actionable insights regarding failures within service interactions. Identifying these failures can help you target pain points and correct your team’s performance, according to Gartner[3].
How to calculate customer satisfaction
CSAT feedback is captured through a variation of the question: “How satisfied were you with your recent service experience?” Customers rate their degree of satisfaction on a seven-point scale.
To calculate CSAT, add all respondents who rated some degree of satisfaction (“somewhat satisfied,” “satisfied,” and “strongly satisfied”) to the CSAT question. Then, divide that number by the total number of respondents.
For example, if you have 100 respondents with 70 ratings between 5 (“somewhat satisfied”) and 7 (“strongly satisfied”), then your CSAT value is 70%.
Hack your CSAT
To maximize the value of your CSAT question, adjust the wording so it aligns with your customer service and support goals. Below are some examples of what this might look like:
If your goal is to decrease customer effort and increase operational efficiency, word your CSAT question like this: “What is your level of satisfaction with the time you spent on the call?”
If your goal is to increase the adoption of your chat feature, ask customers: “How satisfied were you with your recent experience with our chat support?”
If your goal is to improve issue resolution and interaction quality, ask: “Please rate your satisfaction level with the agent’s ability to understand your needs.”
What a good CSAT looks like
Like customer retention rate, customer satisfaction tends to vary by industry. The higher the score, the better, but Gartner recommends using your own performance—instead of external benchmarks—to develop CSAT targets.
In addition to tracking CSAT, pay attention to customer feedback that indicates dissatisfaction or satisfaction, and use that to inform your customer retention strategy. (Hint: Speech analytics software is handy for this as well as CES.) The table below[3] shows examples of what to listen for when using analytics to identify customer satisfaction feedback.
Service area | Examples of dissatisfied customer feedback | Examples of satisfied customer feedback |
|---|---|---|
Process | “Not happy with that solution,” “Long wait time” | “Took less time than expected,” “Happy with the solution” |
Agent performance | “You’re not listening,” “I can’t understand you” | “Glad you resolved this,” “You are so helpful” |
/ Software tools to try
Like survey software, customer satisfaction tools allow you to collect customer feedback. In addition, they help you manage reviews and connect with your customer base across multiple channels to ensure satisfaction. They can even integrate with your CRM and product management tools to help apply acquired feedback to your customer retention strategy.
3. Customer effort score
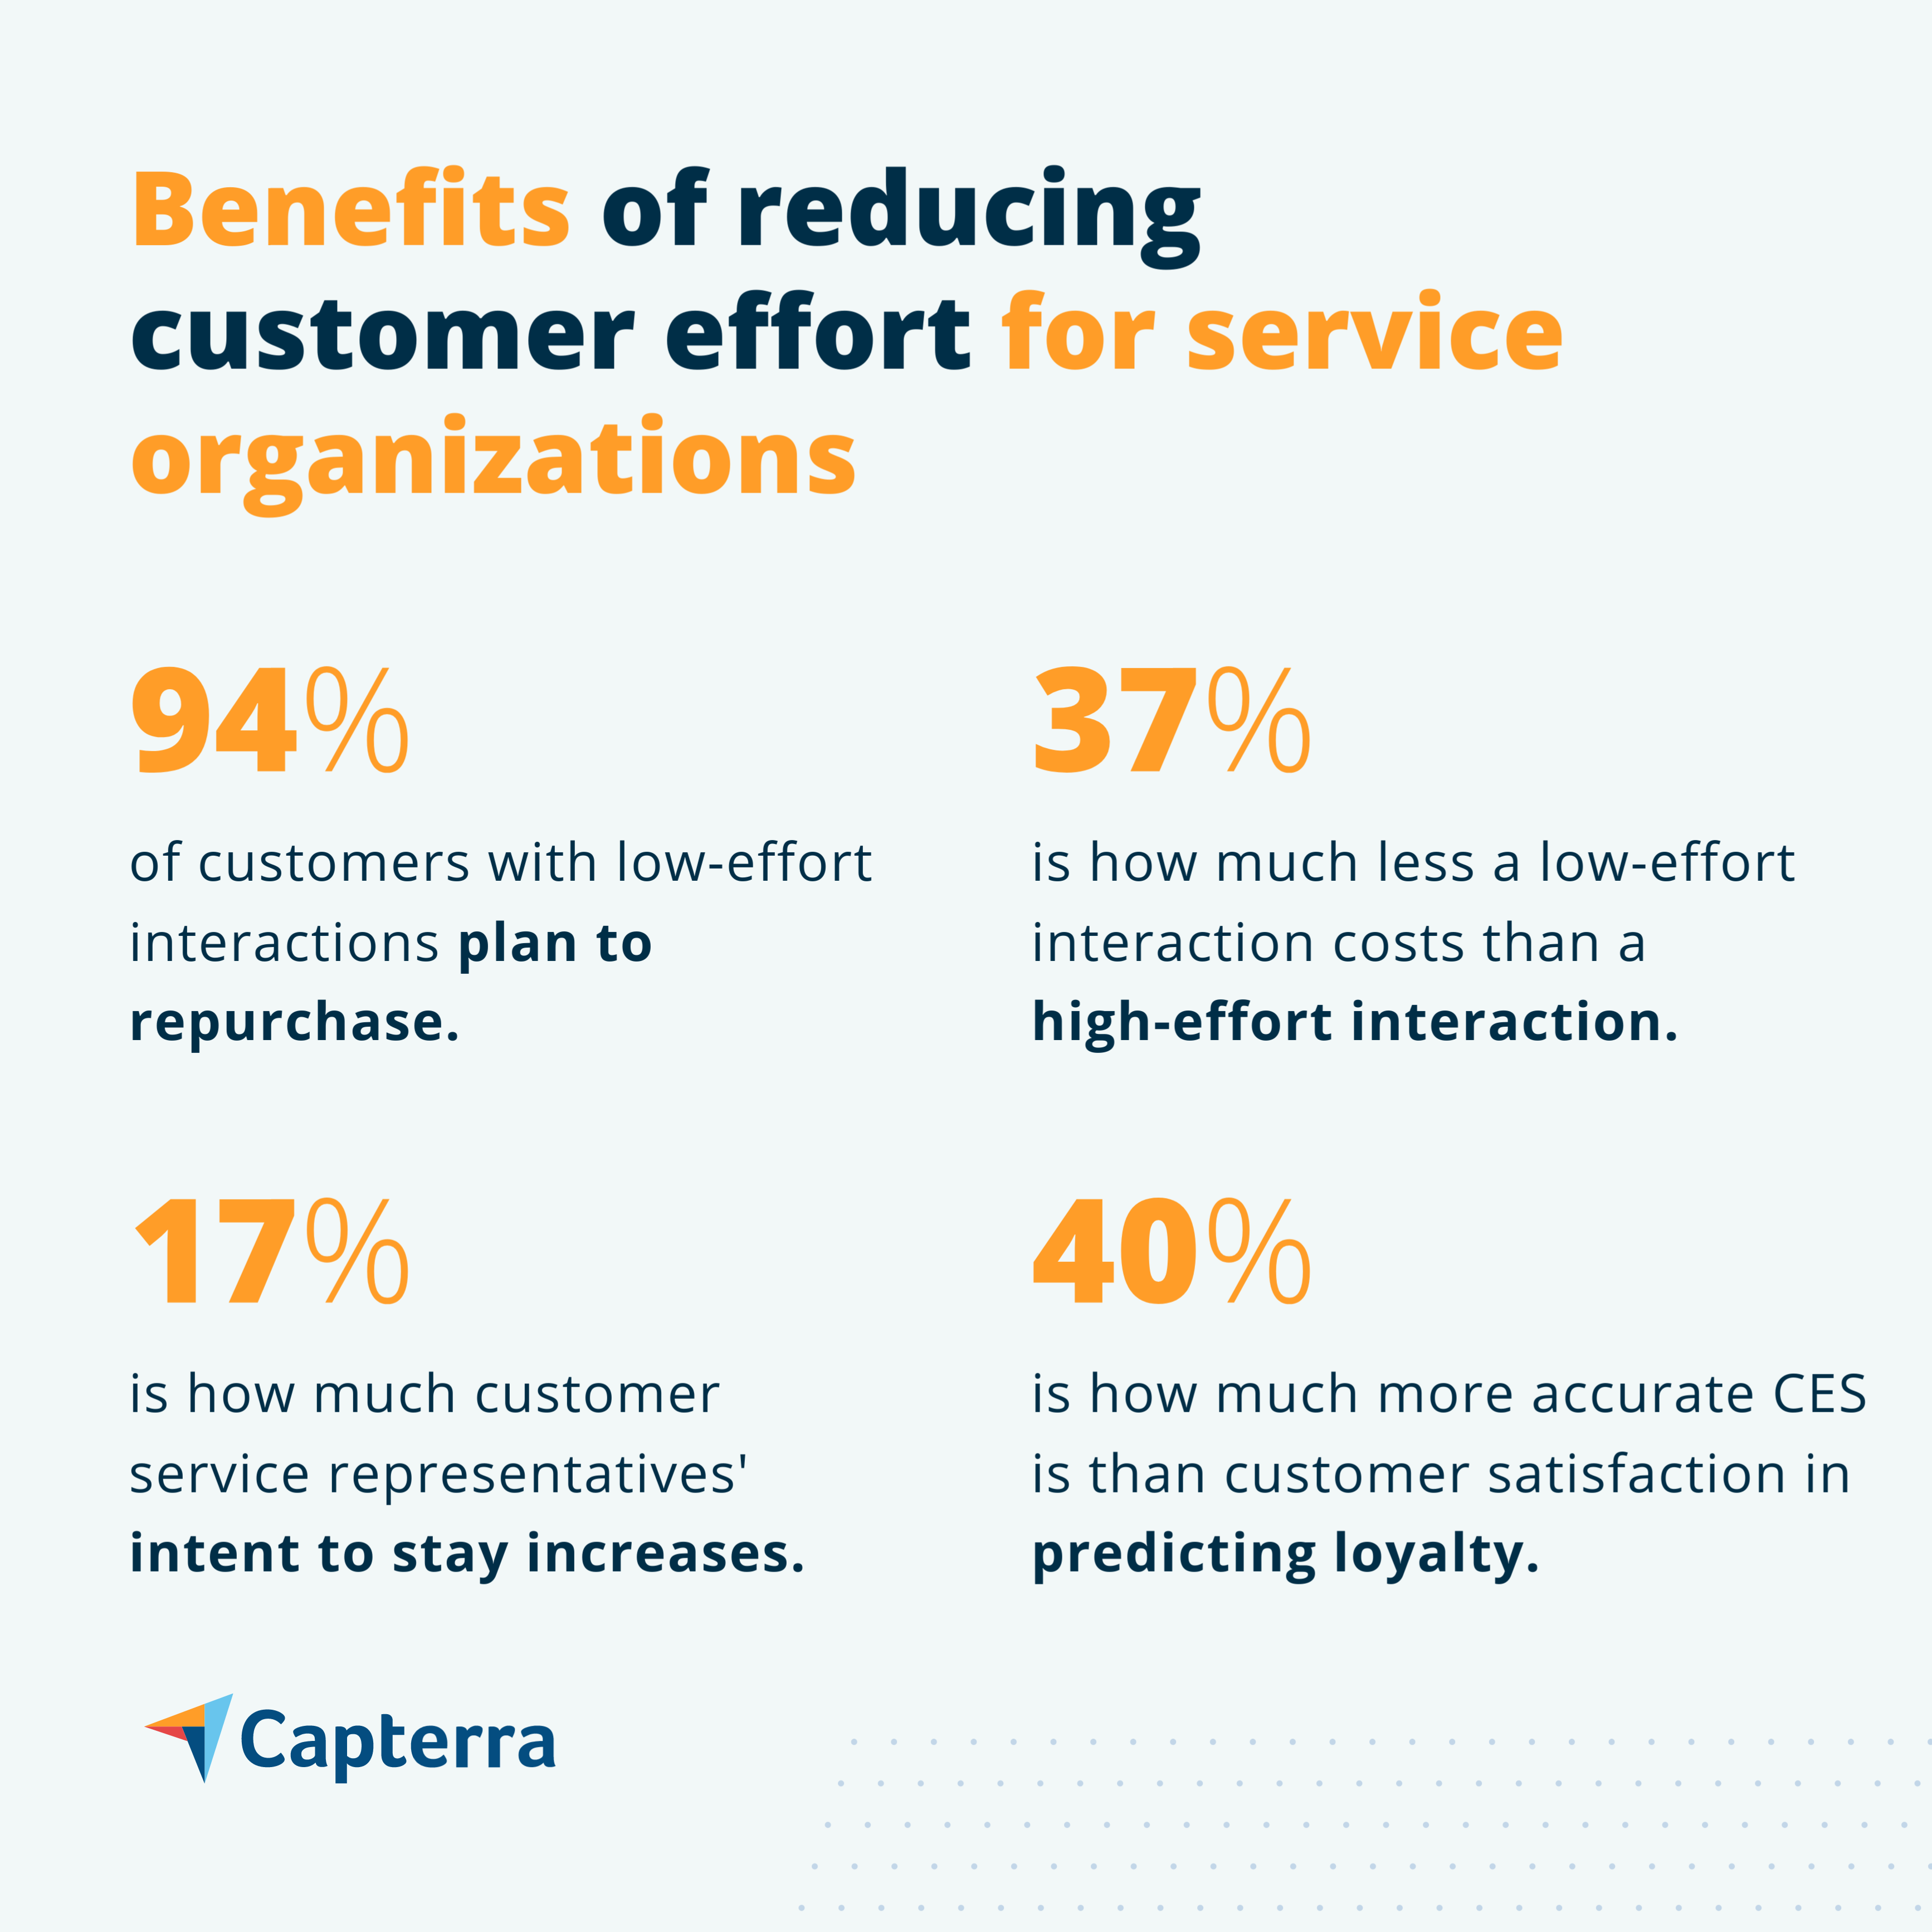
Customer effort score gauges the amount of effort customers feel they exerted on their issue or question during a service interaction. Gartner research[4] finds that businesses that reduce customer effort see higher repurchase rates; reduced costs by decreasing the number of escalations, repeat calls, and channel switching; and increased employee retention.

How to calculate customer effort score
Also based on a seven-point scale, CES asks: “To what extent do you agree or disagree with the following statement? The customer service agent made it easy for me to solve my issue.”
To calculate the score, divide the number of respondents who answered with a 5 or above (“somewhat agree,” “agree,” or “strongly agree”) by the total number of respondents.
For example, if you have 100 respondents with 70 responses between 5 (“somewhat agree”) and 7 (“strongly agree”), you’d have a CES of 70%.
What a good customer effort score looks like
When measuring CES, your goal is to move customers out of active disagreement or neutral territory—the more customers you can get to answer with a 5 or above, the better. The threshold is set at “somewhat agree” rather than “strongly agree” because the difference in the degree of loyalty is negligible among customers who give a 5 or above[4].
Boosting customer loyalty is good, but the larger goal of CES is to keep customers from becoming disloyal. Customers are four times more likely to leave a service interaction more disloyal than when they entered [4], and disloyal customers are likely to have a negative impact on your business through negative word-of-mouth and lower repurchase rates.
/ Software tools to try
Speech analytics software can capture customer feedback from 100% of service interactions, providing a more complete picture of the customer experience than surveys alone. These tools capture customer phrases that indicate high effort (e.g., “second time calling,” “website was confusing”), which can allow your team to correct its performance.
4. Customer health score
The last user retention metric we’ll cover is customer health score (CHS), which Gartner[5] defines as a predictor of future customer behavior such as their likelihood to churn, renew, expand, or advocate for your brand. CHS provides organizations an objective and reliable view of their customer base, which signals warnings or opportunities for improvement in a timely manner.
CHS is different from other metrics because it’s proactive rather than reactive: Metrics such as CES and CSAT are based on past service interactions, and while the feedback they provide is useful, it has its limits. For instance, an existing customer can be satisfied with an interaction, but that doesn’t necessarily mean they’ll renew your service or repurchase your product[5].
Because CHS anticipates future scenarios, it’s particularly valuable for businesses offering subscription services, or if your revenue streams depend on current customers. Regardless of your business model, though, customer service professionals can use CHS to:
Identify customers likely to contact customer service regarding specific issues.
Identify customers most likely to become advocates, provide referrals, or act as reference accounts to help drive new business.
Uncover pain points within a customer’s journey and provide proactive support.
Compare different customers and/or segments to identify factors that lead to different outcomes.
How to calculate customer health score
CHS is not as straightforward as other metrics because it’s based on customer actions that are uniquely important to your business, such as engagement with surveys or purchase frequency. Gartner[5] recommends the following steps to create a scoring system that will be useful to your business:
1. Determine the outcome you want to drive.
Common outcomes that organizations aim to drive when calculating CHS include customer retention, company growth, and advocacy.
2. Assess the availability and quality of customer data.
To ensure your CHS accurately reflects the current state of your customer base, you need relevant, accurate, and up-to-date data. Identify customer data that can be used to create a scorecard based on the following questions:
What data do you have access to, and what can be obtained from other teams?
Is the data meaningful, actionable, and consistently applicable across customers?
Is it related to the outcome you want to drive?
If not, what additional data do you need to gather, and how do you plan to do so?
If you have limited data in the beginning, start with a simple scorecard. As you build your tech stack and gain access to more data, you can update your CHS to reflect the data you collect.
3. Identify and weight attributes.
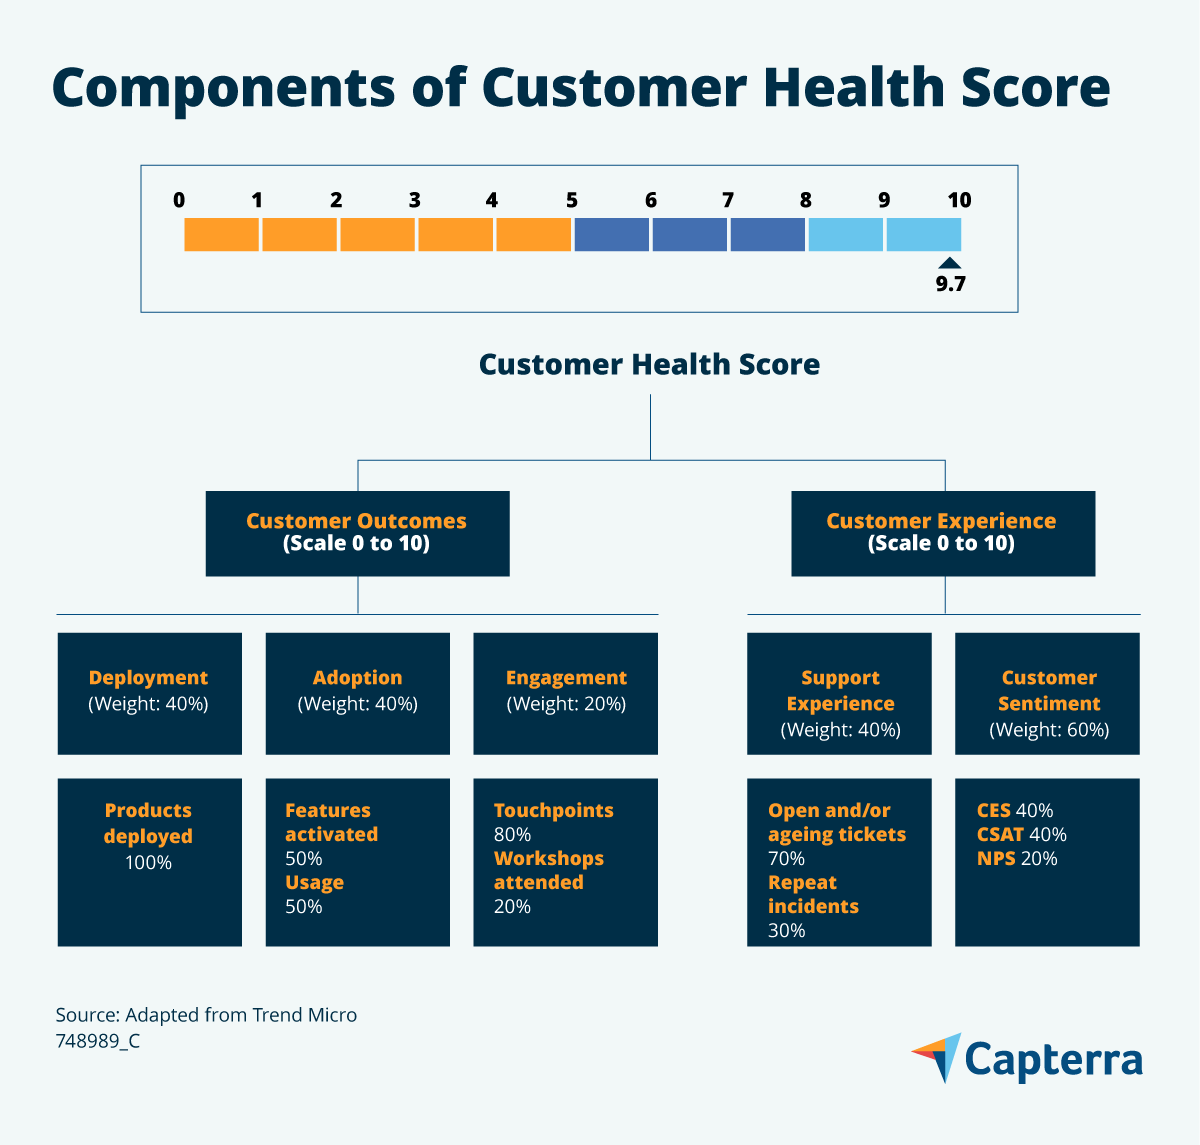
Most health scores typically include attributes that fall under two broad categories: product usage, and service and support experience. The product category includes attributes such as product deployment, adoption, and engagement, while service includes attributes such as overall customer experience and sentiment.
While identifying the attributes is important, weighting them is equally important since certain attributes may be stronger indicators of customer health than others. How much weight you assign to an attribute depends on its ability to influence the outcome. For example, if you want to drive product adoption, assign a higher weightage to indicators such as duration of use and features activated.
4. Determine the scale you want to use to measure customer health.
Organizations typically use a one through 10 or 100 scale to denote health status. You may also use color-coding (such as red, yellow, and green) to offer an easy-to-view assessment of a customer’s health and quickly identify those in need of support. The graphic below shows what a color-coded CHS and its weighted attributes could look like.

/ Software tools to try
Customer success software enables your business to understand its relationship with its customer base by compiling data from customer relationship databases and customer service communication channels. By scoring customer success, the software allows you to proactively identify customers that require extra support and even highlights customers that may be ready for additional products or services.
Prioritize customer success as your business grows
Value enhancement score, customer satisfaction, customer effort score, and customer health score may not be the most widely used KPIs, but we recommend these because of the clearly defined impact they can have on your customer retention strategy.
As your business grows, here are some other customer retention metrics that you can use to supplement the ones we’ve covered. (Hint: Your CRM may track some of these for you.)
Customer retention rate is the percentage of customers who stay customers over a given time frame.
Customer churn rate is the percentage of customers you’ve lost over a given time frame. It’s also the inverse of customer retention rate.
Customer acquisition cost is the average amount of money (e.g., sales and marketing expenses) you’ve spent to gain each new customer.
Customer lifetime value tracks how much money your business can expect from a customer over the average time they stay with your business.
Repeat purchase ratio, also known as repeat purchase rate, is the percentage of repeat customers within a certain time frame after their first purchase.
Looking for more resources on customer retention? Give these a read:
