Learn about Jira dashboards and how to use them for project management.
One of the best ways to get value from your new project management software is to use its dashboard functionalities to their fullest potential. Dashboards are crucial to supporting several key project management software features, such as project planning and reporting.
We wrote this guide for project managers, marketing professionals, and business owners who are starting out with the Jira software, one of the products from its parent company Atlassian.
We have a unique understanding of what users like and dislike about Jira dashboards based on dozens of verified reviews from Jira users that explicitly mention this functionality. These insights are coupled with our research into Jira’s online community of users and other reliable first- and third-party resources to help you know what to expect and how to get the most out of your new system.
What is a Jira dashboard?
A Jira dashboard is a display tool for individual or multiple teams to monitor their work, spot issues such as overdue tasks or blocked processes, and stay updated on project timelines.
It is made of several components referred to as "gadgets"This helps users track project progress, view real-time data/performance metrics, assign work, and set task completion deadlines in an organized manner.
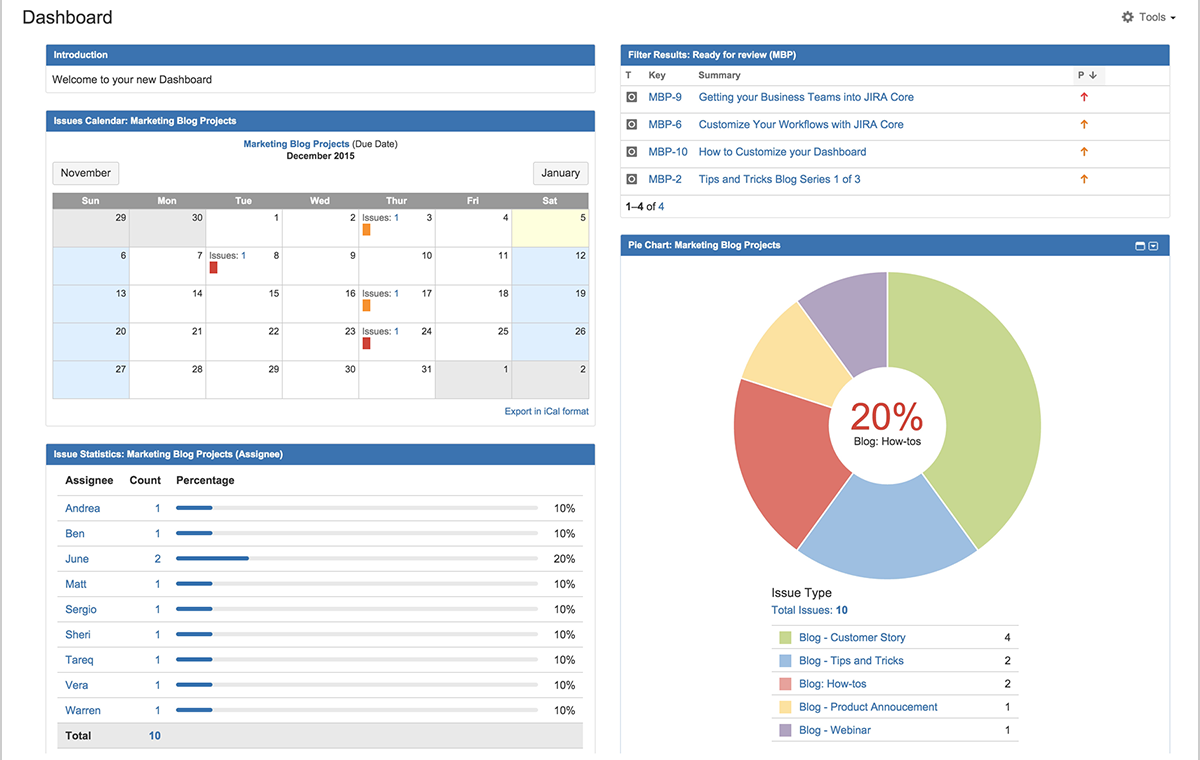
Jira core dashboard, offering a glance at a project’s status[1]
Jira templates vs. Jira gadgets: What's the difference?
Jira gadgets are individual widgets in Jira’s software that show specific projects' real-time data, allowing users to set up a dashboard tailored to their needs. For instance, a project manager might use a "Burndown Chart" gadget to track a sprint’s progress. On the other hand, Jira dashboard templates are a convenient option for those less familiar with gadgets.
Templates are pre-built layouts made of various Jira gadgets, enabling users to quickly start working with a functional dashboard. For example, a "Project Overview" template would already include essential gadgets that might be ideal for a project manager needing a comprehensive view of project status, without the hassle of selecting individual gadgets.
How do Jira users feel about its dashboards?
We analyzed 3,011 verified user reviews of Jira software on Capterra*, specifically focusing on reviews mentioning “Jira dashboards” and “Jira charts.” This analysis can help new users such as yourself get an idea of what other Jira users find most helpful and most challenging about its dashboards, so you can better anticipate what to expect.
Mentions of Jira dashboards and Jira charts in reviews: 121
Percentage of positive mentions: 67%
Percentage of negative mentions: 24%
We used a proprietary algorithm to identify the most informative excerpts. Excerpts are evaluated for positive or negative sentiment and receive a sentiment score. We highlighted excerpts with the highest positive sentiment score and the lowest negative sentiment score**.
Here are some positive review excerpts from professionals who have used Jira dashboards for project management:
“It assists a development team in better project management by giving numerous tools to keep track of the project, accept inputs from other groups, establish a dashboard, and communicate with the team.”
“It has multiple views and is used to manage projects, so people who want to see an overview of the work can use the To-do List or simply the Roadmap, and team members who are trying to balance their daily activities can use the Dashboard to plan their workload.”
“Jira allows the user to create various filters and dashboards to keep track of his/her various tickets, tasks, and requests.”
“The flexible creation of dashboards and filters has helped me keep my project tasks and tickets in a coordinated and neat manner, which has ensured I do not miss out on anything important unnecessarily.”
Here are some negative review excerpts from professionals who have used Jira dashboards for project management:
“I've experienced instances where there are growing pains in how internal teams learn to standardize the way they tag tickets for project and task tracking and then use these identifiers to develop reports, create dashboards, and track schedules.”
“Missing better manager features like Gantt, more high-level plan overview and need to update the old dashboards layout and way of build.”
“A Basic Text Editor gadget for Dashboards needs to be created by Jira (not a third party) with no security holes (because of the HTML).”
“If I have to choose a pain point, dashboards are really really painful to craft, and is really easy to face simple limitations that require a paid plugin to allow you to get what you need.”
“Complex navigation can make it hard for a new user to traverse from one dashboard to another.”
Read more Jira software reviews here.
Besides these review snippets, Capterra also offers a video collection featuring in-depth reviews from Jira users, sharing their complete software experience. Check it out:
Listen to customers sharing their experiences with Jira software (Source)
8 Jira dashboard examples to explore for project management
As we said, Jira dashboards are made up of Jira gadgets, and these gadgets can display numerous reports and summaries of team progress with other data from Jira projects. All these together make up a dashboard. These gadgets can be customized to show projects and provide details relevant to specific users. Let’s look at some examples of dashboards Atlassian discussed on its product and news (blog) page and Atlassian support page.
1. Sprint health and sprint burndown Jira dashboard
Screenshot taken by the author
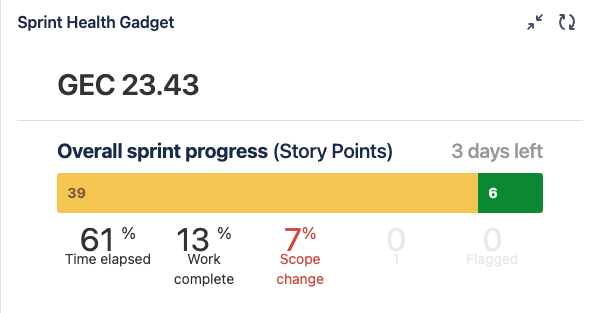
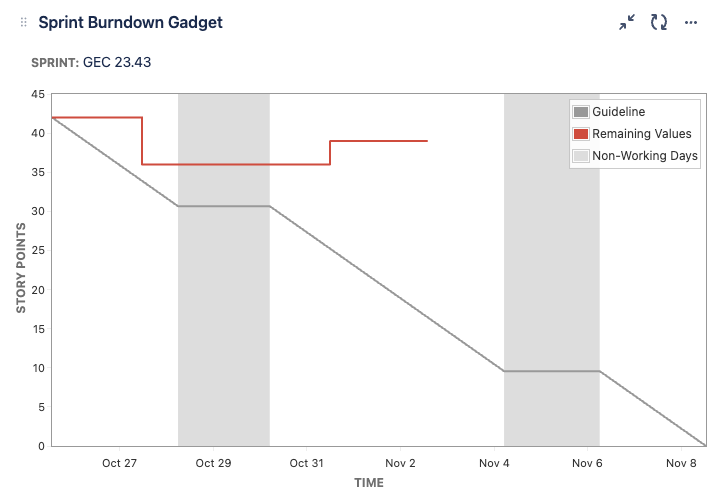
These can also be called Agile Jira dashboards as they can be helpful for Agile teams, especially during sprints. It's also used by Scrum masters and project managers to track the current sprint's progress and burndown rate.[2]
Screenshot taken by the author
By incorporating Jira dashboard gadgets such as the Sprint Health Gadget and Burndown Chart Gadget, you can visually monitor sprint goals against the work remaining, helping to ensure timely delivery and the ability to spot any potential roadblocks early with its real-time sprint tracking capability.[3]
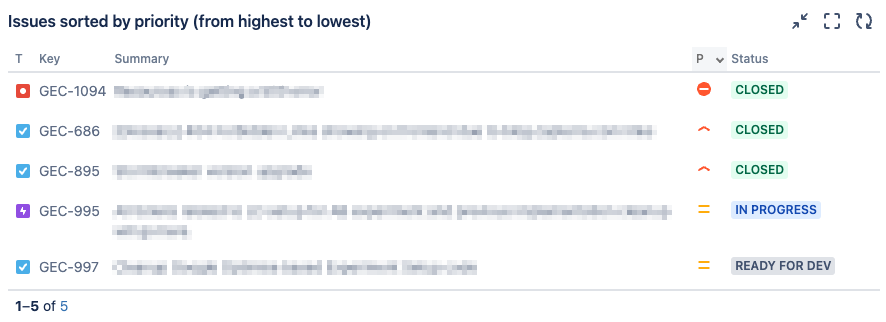
2. High-priority issues Jira dashboard
Screenshot taken by the author
Aimed at tackling critical tasks, this Jira dashboard example can be utilized by team leads. It employs gadgets such as the Filter Results Gadget to highlight high-priority issues, to help teams address them promptly. This dashboard can help bring urgent tasks to the forefront, aiding in risk mitigation and timely resolution.[4]
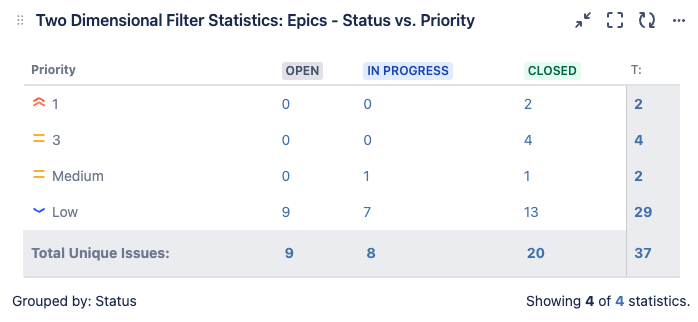
3. Two-dimensional filter statistics Jira dashboard
Screenshot taken by the author
This example of a Jira dashboard serves to provide a visual representation of issues based on two attributes, such as status and priority. It can be beneficial for project analysts looking to understand the issue landscape better.[4] By using the Two-Dimensional Filter Statistics Gadget, users can spot trends or problem areas quickly. This dashboard’s grid view can help simplify data interpretation.[5]
4. Continuous integration Jira dashboard
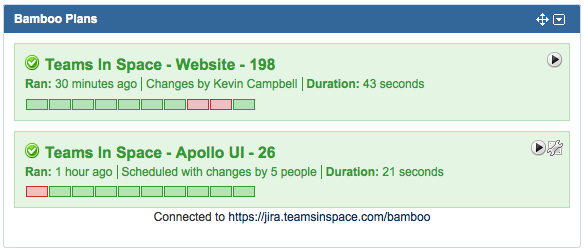
A representation of continuous integration dashboard [4]
This Jira dashboard monitors the continuous integration process, a practice where code updates are regularly merged and tested to detect errors early. With gadgets such as the Build Monitor Gadget and Bamboo Plans gadget, users can ensure changes in the program code are correctly blended and functioning as expected in the existing system. It's pivotal for maintaining code quality and addressing issues such as merging conflicts promptly, making its design suitable for its focus on the integration lifecycle.[4]
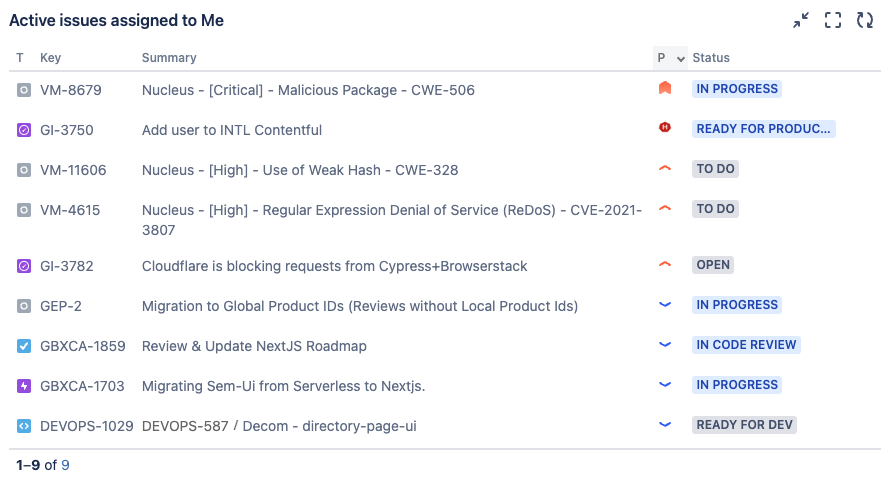
5. Assigned-to-me Jira dashboard
Screenshot taken by the author
This personalized Jira dashboard example is for individual team members to manage their workload. By using the Assigned to Me Gadget, users can see all tasks assigned to them, making task management and prioritization easier.[6]
6. Issue statistics overview and organization overview Jira dashboards
Screenshot taken by the author
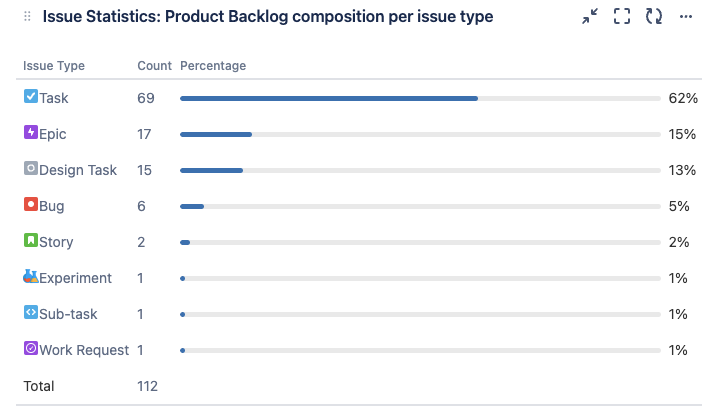
Offering a broader view, these Jira dashboards use the Issue Statistics Gadget, where you can get a snapshot of issues and organizational activities, aiding in better project oversight. It can help in providing a high-level overview of both issues and organizational activities.[7]
7. Project overview (ongoing projects) Jira dashboards
Screenshot taken by the author
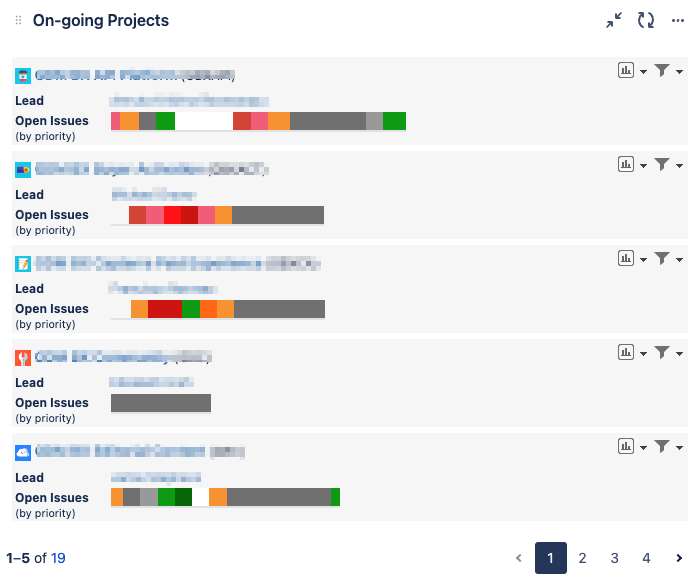
This Jira dashboard provides a broad view of project status and activities. Gadgets such as the Project Fields Information are utilized to display ongoing project data. Its comprehensive, yet straightforward, project insight can aid in better project management.[8]
8. Time-in-status Jira dashboards
Screenshot taken by the author
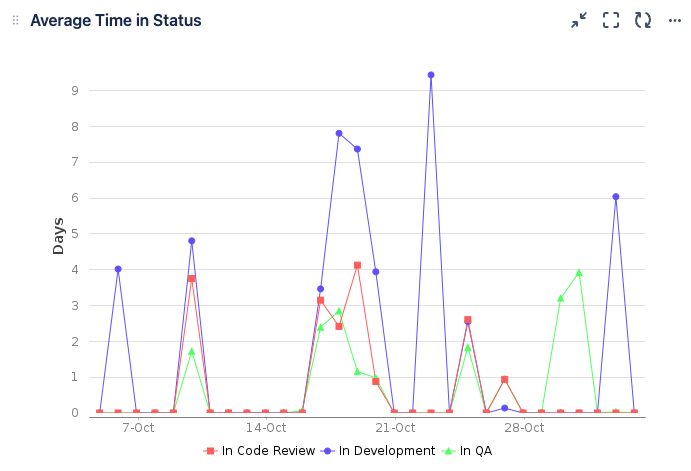
You can use this Jira dashboard to analyze task timelines. The Time-in-Status Gadget can measure process efficiency and identify bottlenecks. It can help track issue status over time for process improvement.[9] It might be useful to project analysts and managers who usually analyze project efficiency and timelines.
How do you create a Jira dashboard?
Now that you understand the basics, creating a Jira dashboard is just a series of five steps.
Note: All the screenshots below are sourced by the author.
Step 1: Create a new dashboard
1. Click on the “Dashboards” icon in the main menu.

2. Press “Create Dashboard.”

3. In the pop-up window, enter the relevant dashboard details:
Name your dashboard in the “Name” field.
Include a short project description in the “Description” field.

4. Under “Viewers,” press the drop-down button to choose who can access the dashboard.
5. Click “Save” to open up a blank Jira dashboard.

Step 2: Add gadgets to your Jira dashboard
Click the “Add Gadget” tab in the right corner of the blank dashboard screen.
A window will appear showing different gadgets—choose the ones you find suitable.
Each gadget has an “Add Gadget” button on the right side of its name. Click it to add the gadget.
Press “Close” to return to the main window after adding gadgets.

Step 3: Customize the added gadgets in your Jira dashboard
Click the ellipsis (...) on the right side of the gadget to access customization options.
Options include changing the gadget’s highlight color, renaming it, deleting it, and more.
Click the “Configure” option to change gadget settings.
Click “Save” after making changes.

Step 4: Change the layout
Press “Change Layout” in the right corner of the main dashboard menu.
Choose from five layout options.
The dashboard will automatically update to the selected layout.

Step 5: Share your Jira dashboard
Click the ellipsis (...) on the right side of the dashboard.
Press “Edit and Share” to share the dashboard with your team.
Frequently asked questions about Jira dashboards
Jira dashboards offer various functionalities. Let’s take a look at some of the common ones with the solutions verified by Jira software support[10]:
Q: How do you create Jira dashboards for multiple projects?
The Different Team Tracker Dashboard is ideal for managing multiple projects. It allows you to track and compare team performances across different projects, streamlining multi-project management. Here’s a view of the different team tracker dashboards:

Different team tracker Jira dashboard (Screenshot taken by the author)
Q: How do you add filters in a Jira dashboard?
To add filters, go to your dashboard, click "Add Gadget," and find and add the "Filter Results" gadget. Configure it with your desired filter query to see specific issue types, priorities, or other criteria.
Q: How do you customize a Jira dashboard?
Navigate to your Jira dashboard, click "Add Gadget" to add new gadgets, or hover over existing gadgets to find the edit or delete options, allowing you to rearrange or remove gadgets as needed.
Q: How do you share the Jira dashboard link or share a dashboard with others?
Click on the “...” menu on your Jira dashboard, select “Share dashboard,” then choose with whom you want to share it, be it individuals or groups. You can also copy the dashboard link and share it directly through email.
Q: How do you review advanced gadgets and charts on a Jira dashboard?
Navigate to your dashboard, click "Add Gadget," and explore gadgets such as the Burndown Chart or Gantt chart. Adding and configuring these gadgets provides a visual representation of project progress and scheduling, assisting in better project management.
Q: How do you export Jira dashboard to PDF, Excel, or other platforms?
To export your Jira dashboard to Excel or PDF, navigate to your dashboard, add the “Issue Statistics” gadget, configure your filter, and then click on the “Export” option. Select between PDF, Excel, or other available formats to download your data.
Q: How do you integrate Confluence, Tableau, and Power BI with Jira dashboard?
To embed or integrate Jira dashboards with Confluence pages, Tableau, or Power BI for extended data analytics, navigate to your dashboard settings, select “Embed,” and follow the prompts for Confluence, or use Jira’s APIs for Tableau and Power BI connections. These integrations help in better data visualization and analysis across platforms.
Q: How do you review advanced gadgets and charts on the Jira dashboard?
Jira dashboards offer advanced gadgets such as the Burndown Chart for sprint tracking or the Gantt chart for project scheduling. To review these, go to your dashboard, click "Add Gadget," and explore gadgets such as the Burndown Chart or Gantt chart. Adding and configuring these gadgets can provide deeper insights and better project oversight, aiding in effective project management.
Get the most out of your new project management software
Acquiring new software and making the most of it can feel overwhelming. Whether you are a beginner or someone who has been doing it for a while, these resources can help you make the most of your software purchase while sharpening your project management skills:
Also, don’t forget to fill your details in below, and download Capterra's free Software ROI calculator template. It can save you time, and help you plan your strategies accordingly.

