
As service engagement channels proliferate, you need to know where your customers are and where they want to be. Our survey asked them.

In the past year, how have your customers engaged with customer service, either yours or your competitors'?
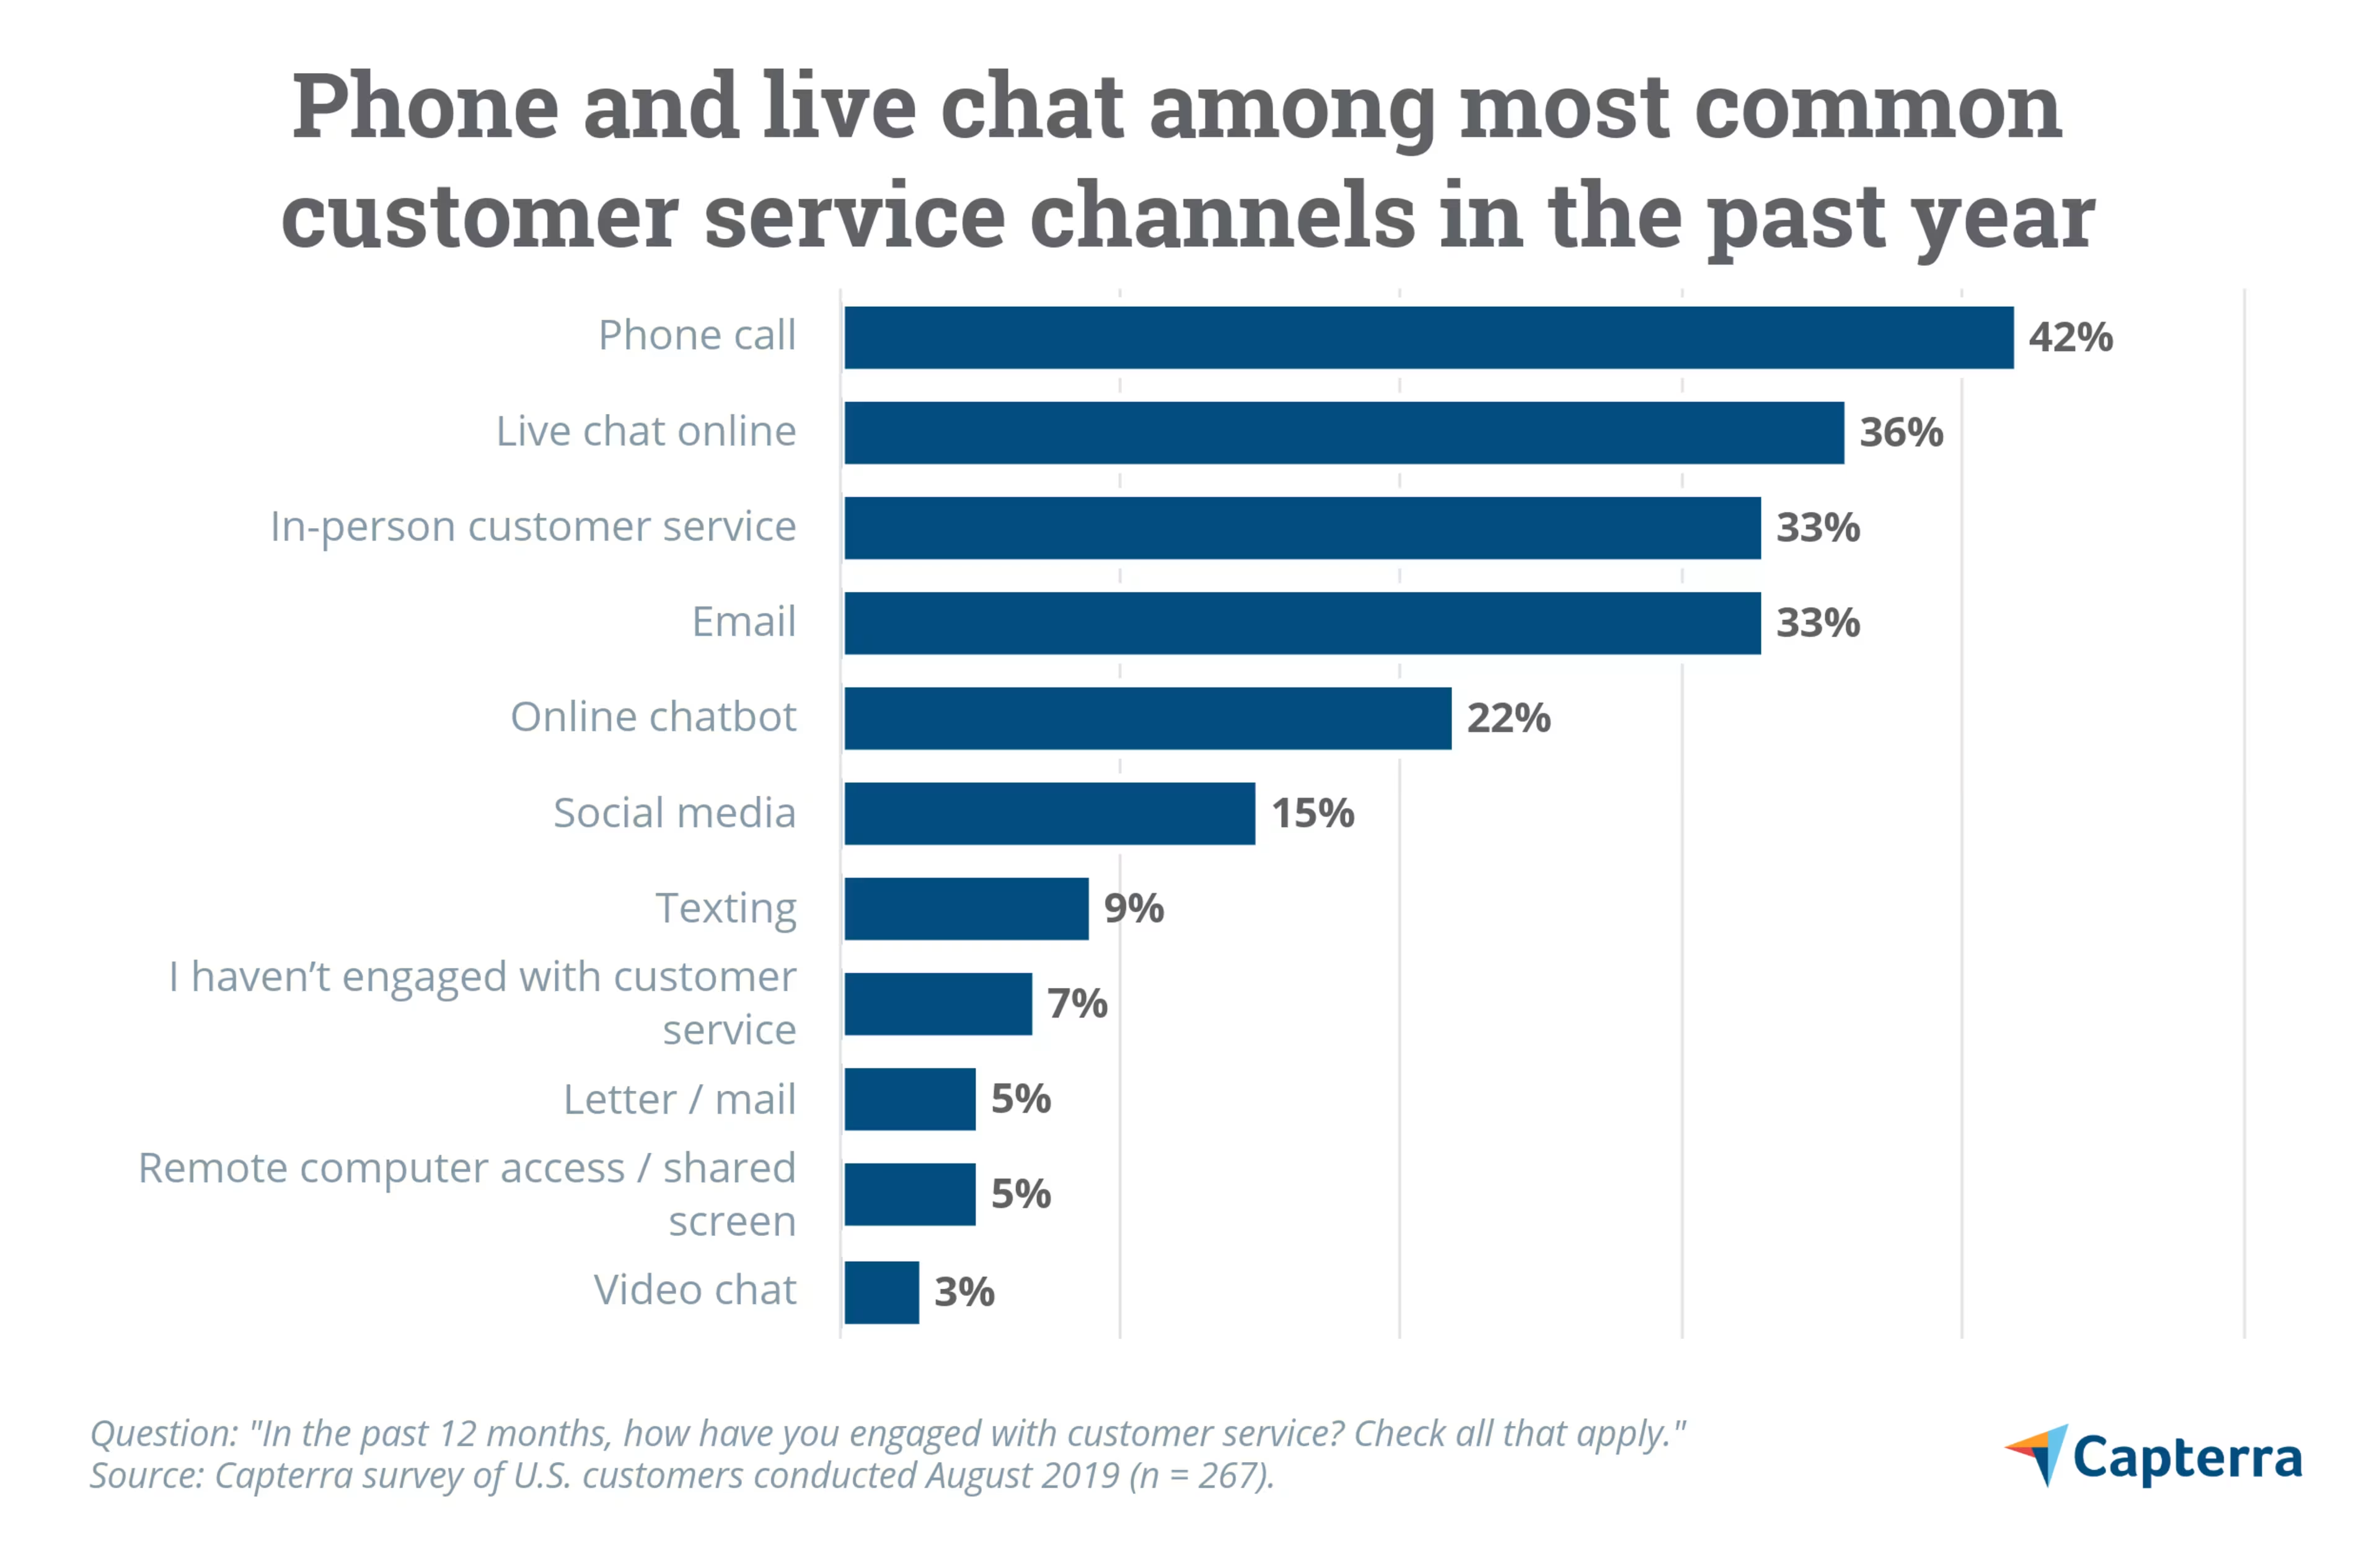
About four-in-ten (42%) U.S. customers who made an online or in-store purchase in the past 12 months had a customer service interaction via phone call during that time, according to a recent Capterra survey. Yet only half as many (21%) say that phone calls are their preferred mode of customer service interactions.
In this article (the second in our series on key findings from our recent customer experience survey), we'll look at:
Common sources of customer service interactions in the past year
Channels where customers had positive and/or negative service experiences
What types of service interaction customers prefer
Use these results to learn where the industry is going and guide your software investment by matching your customer base to their demographic preferences below.
How did customers access service in the past year?
Phone calls (42%) and live chat (36%) were among the most frequently cited channels for customer service in the past year, along with in-person customer service (33%) and email (33%). Fewer customers used texting (9%), letters (5%), remote computer access (5%), or video chat (3%) for customer service interactions.
When it comes to demographic differences, women (41%) were more likely than men (26%) to have used in-person customer service in the past year. In-person service was also cited more frequently by respondents in the suburbs (42%) than those living in rural (26%) or urban (28%) areas.
Urban residents were more likely to use chatbots (30%) than rural (20%) or suburban (15%) residents. Black customers were much more likely to report using social media as a customer service option (34% vs. 8%), and young adults (aged 18 to 35) used chatbots and social media more than older Americans.
Where are customers having good service interactions?
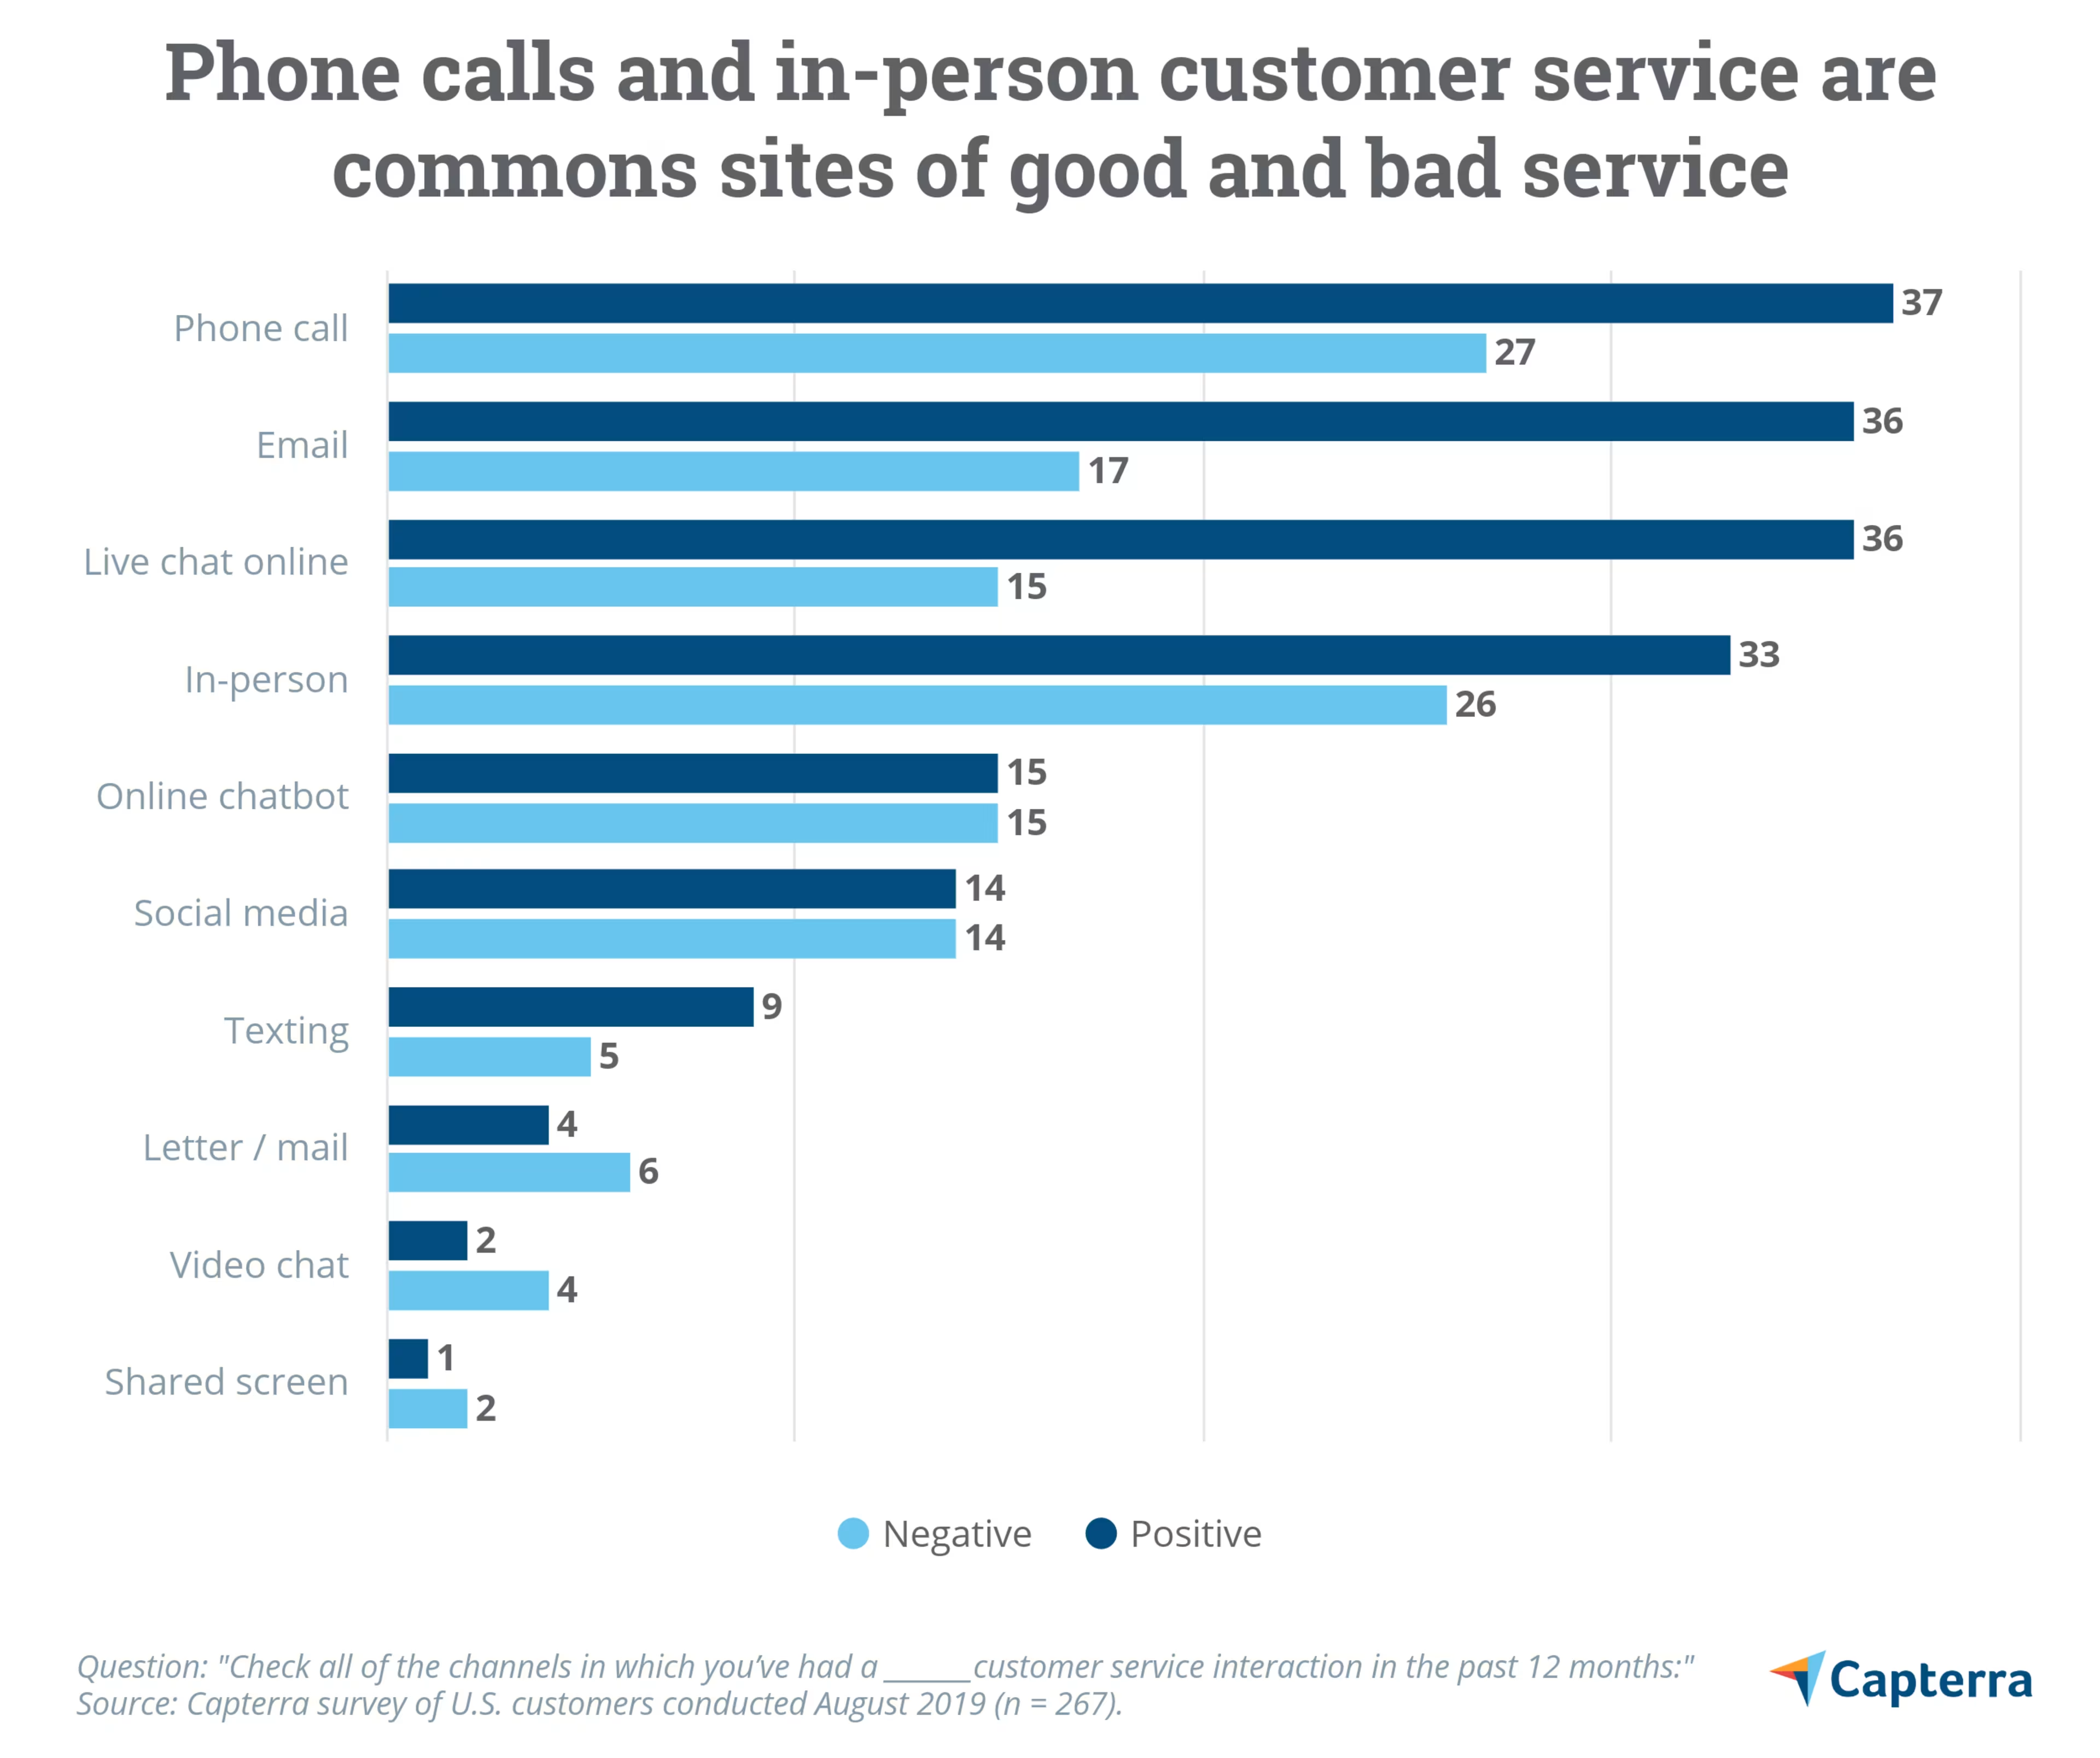
Similar shares of U.S. customers say they've had positive customer service interactions over the phone (37%), via email (36%), through live chat (36%), and in-person (33%).
Older customers (56+) were especially likely to say they had a good service experience via phone (51%) and email (46%). Women were more likely than men to say they had a good in-person service interaction in the past year (40% vs. 27%).
Customers who used chatbots and social media had similar experiences and reported the same percentage of positive and negative experiences for each (15% for chatbots; 14% for social).
Where are customers having bad service interactions?
Phone calls and in-person service were the most common methods of negative interactions in the past 12 months. Older customers (56+) were especially likely to cite negative phone interactions (51%), while those in the suburbs reported more negative in-person service (35%).
Overall, far more respondents reported positive email service interactions than negative ones (36% positive vs. 17% negative). Men were more likely to report a negative email service experience compared to women ( 22% vs. 12%).
What service channels do customers actually prefer?
Customers are somewhat split on their preferred customer service channel. Live chat (27%) and phone calls (21%) are cited most often, followed by in-person service and email (16% each).
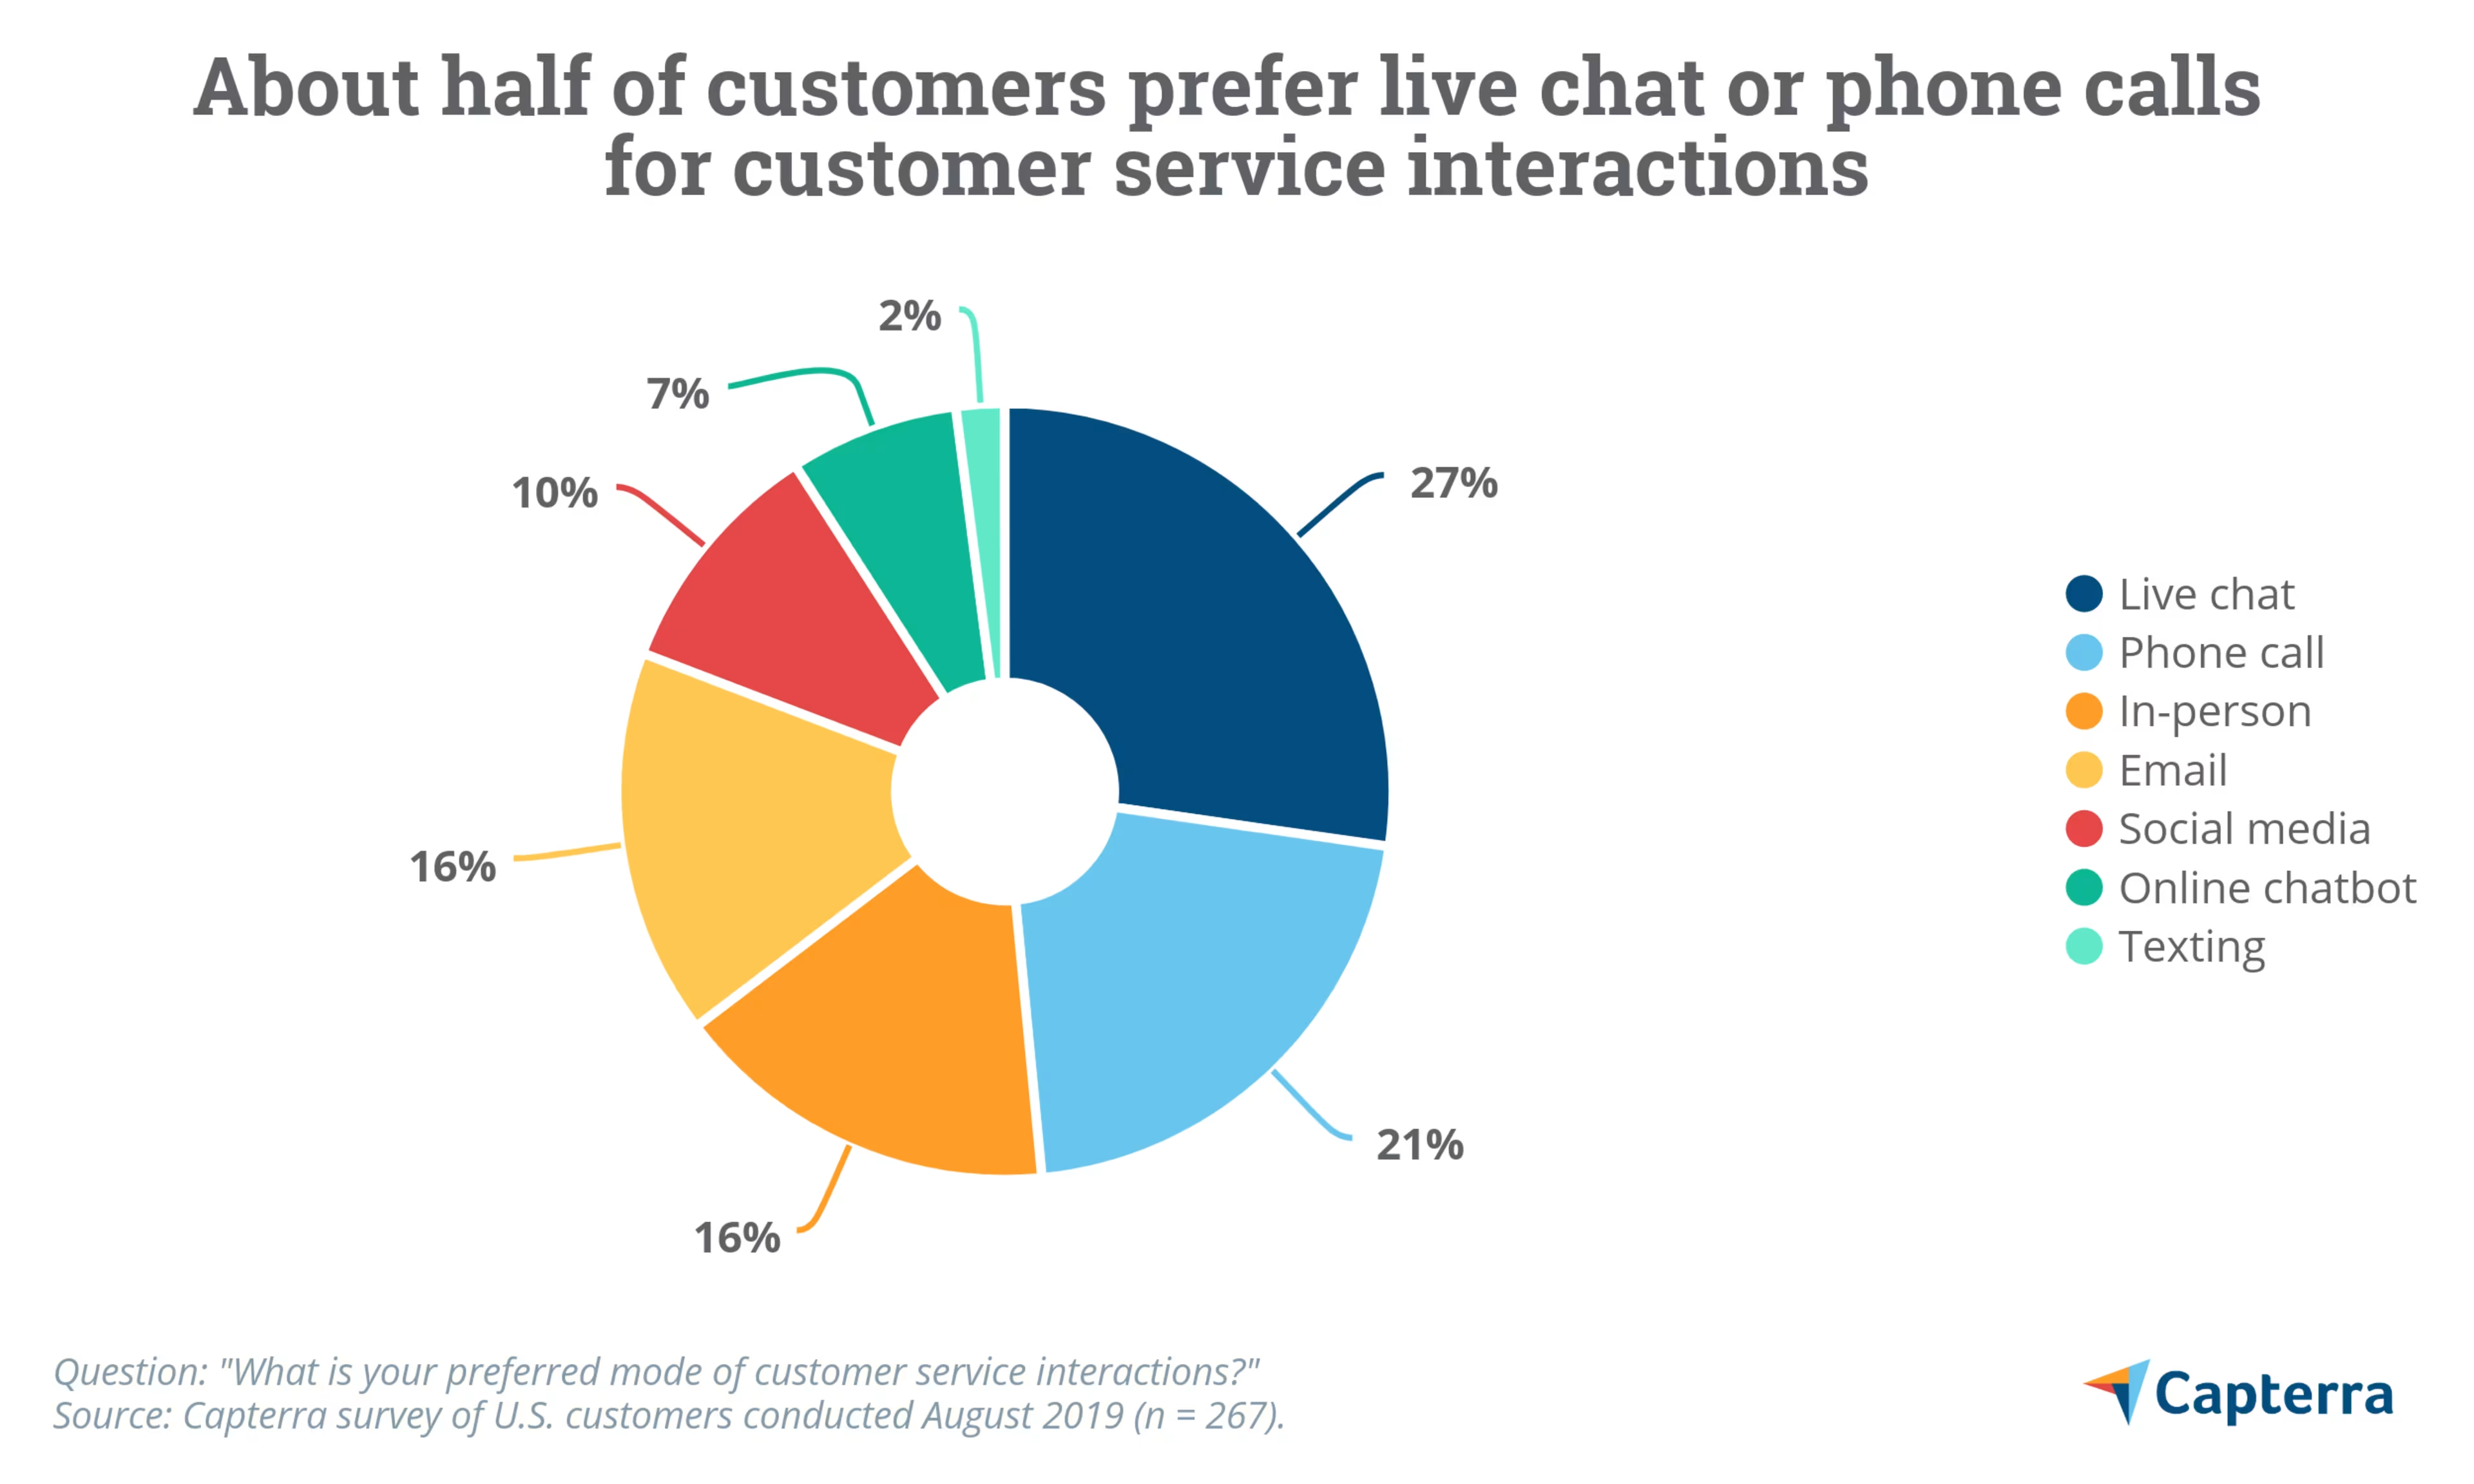
Overall, there were few demographic differences among respondents for this portion of our customer experience survey. Respondents aged 56 years and older prefer phone calls when compared to younger adults (39% vs. 17%). White customers are more likely than black customers to favor live chat service (29% vs. 14%).
Keep up with customer service channel preferences
All this data should leave your business with some key insights such as the following:
Given the high share of customers who prefer live chat, your business should consider investing in live chat customer service software.
If you have a younger or more urban-centric customer base, you may want to invest in social media or chatbot software.
If your customer base is older, you'll need a strong call center.
Using the customer service survey results above, match your customer base to their preferred channel and invest in the right software for that method. This investment will make their experience better, and your job easier.
Capterra's software directories offer reviews from real users and a feature-filtering tool to ensure you're looking at software that actually meets your needs. Check out these customer service channel-related directories to learn more: